Chile’s Copper Windfall Could Top US$9 Billion as the Price Passes US$14,000
Chile · Mining
Key Facts
- The price. Three-month copper on the London Metal Exchange passed US$14,000 a tonne on 4 August and reached US$14,369.50 on Thursday, the highest since the record of US$14,527.50 set on 29 January.
- The trigger. Reuters obtained a Congolese order banning exports of copper and cobalt concentrates. Grasberg in Indonesia is also suspended.
- The windfall. Núcleo Minero estimates every one-cent rise in the annual average price is worth about US$60 million to Chile’s treasury. At a US$6.00 average, that is roughly US$9.7 billion above budget.
- The budget assumption. Chile’s 2026 structural balance was built on US$4.38 a pound. The year-to-date average is US$5.97, and output is falling — Cochilco projects 5.3 million tonnes, down 2 percent.
- The warning. Codelco chairman Bernardo Fontaine said on Thursday the state miner faces “four difficult years” and cannot finance its US$34 billion investment plan.
The Chile copper windfall could reach US$9.7 billion above budget this year as copper tops US$14,000 a tonne — but the country is producing less of it, and Codelco says it cannot fund its own plan.
The Chile copper windfall is real and it is large. Copper on the London Metal Exchange passed US$14,000 a tonne on 4 August and reached US$14,369.50 on Thursday, and Chilean analysts now put the extra take for the treasury at close to US$9.7 billion this year. On the same afternoon, the chairman of Codelco told a mining conference the company faces four difficult years.
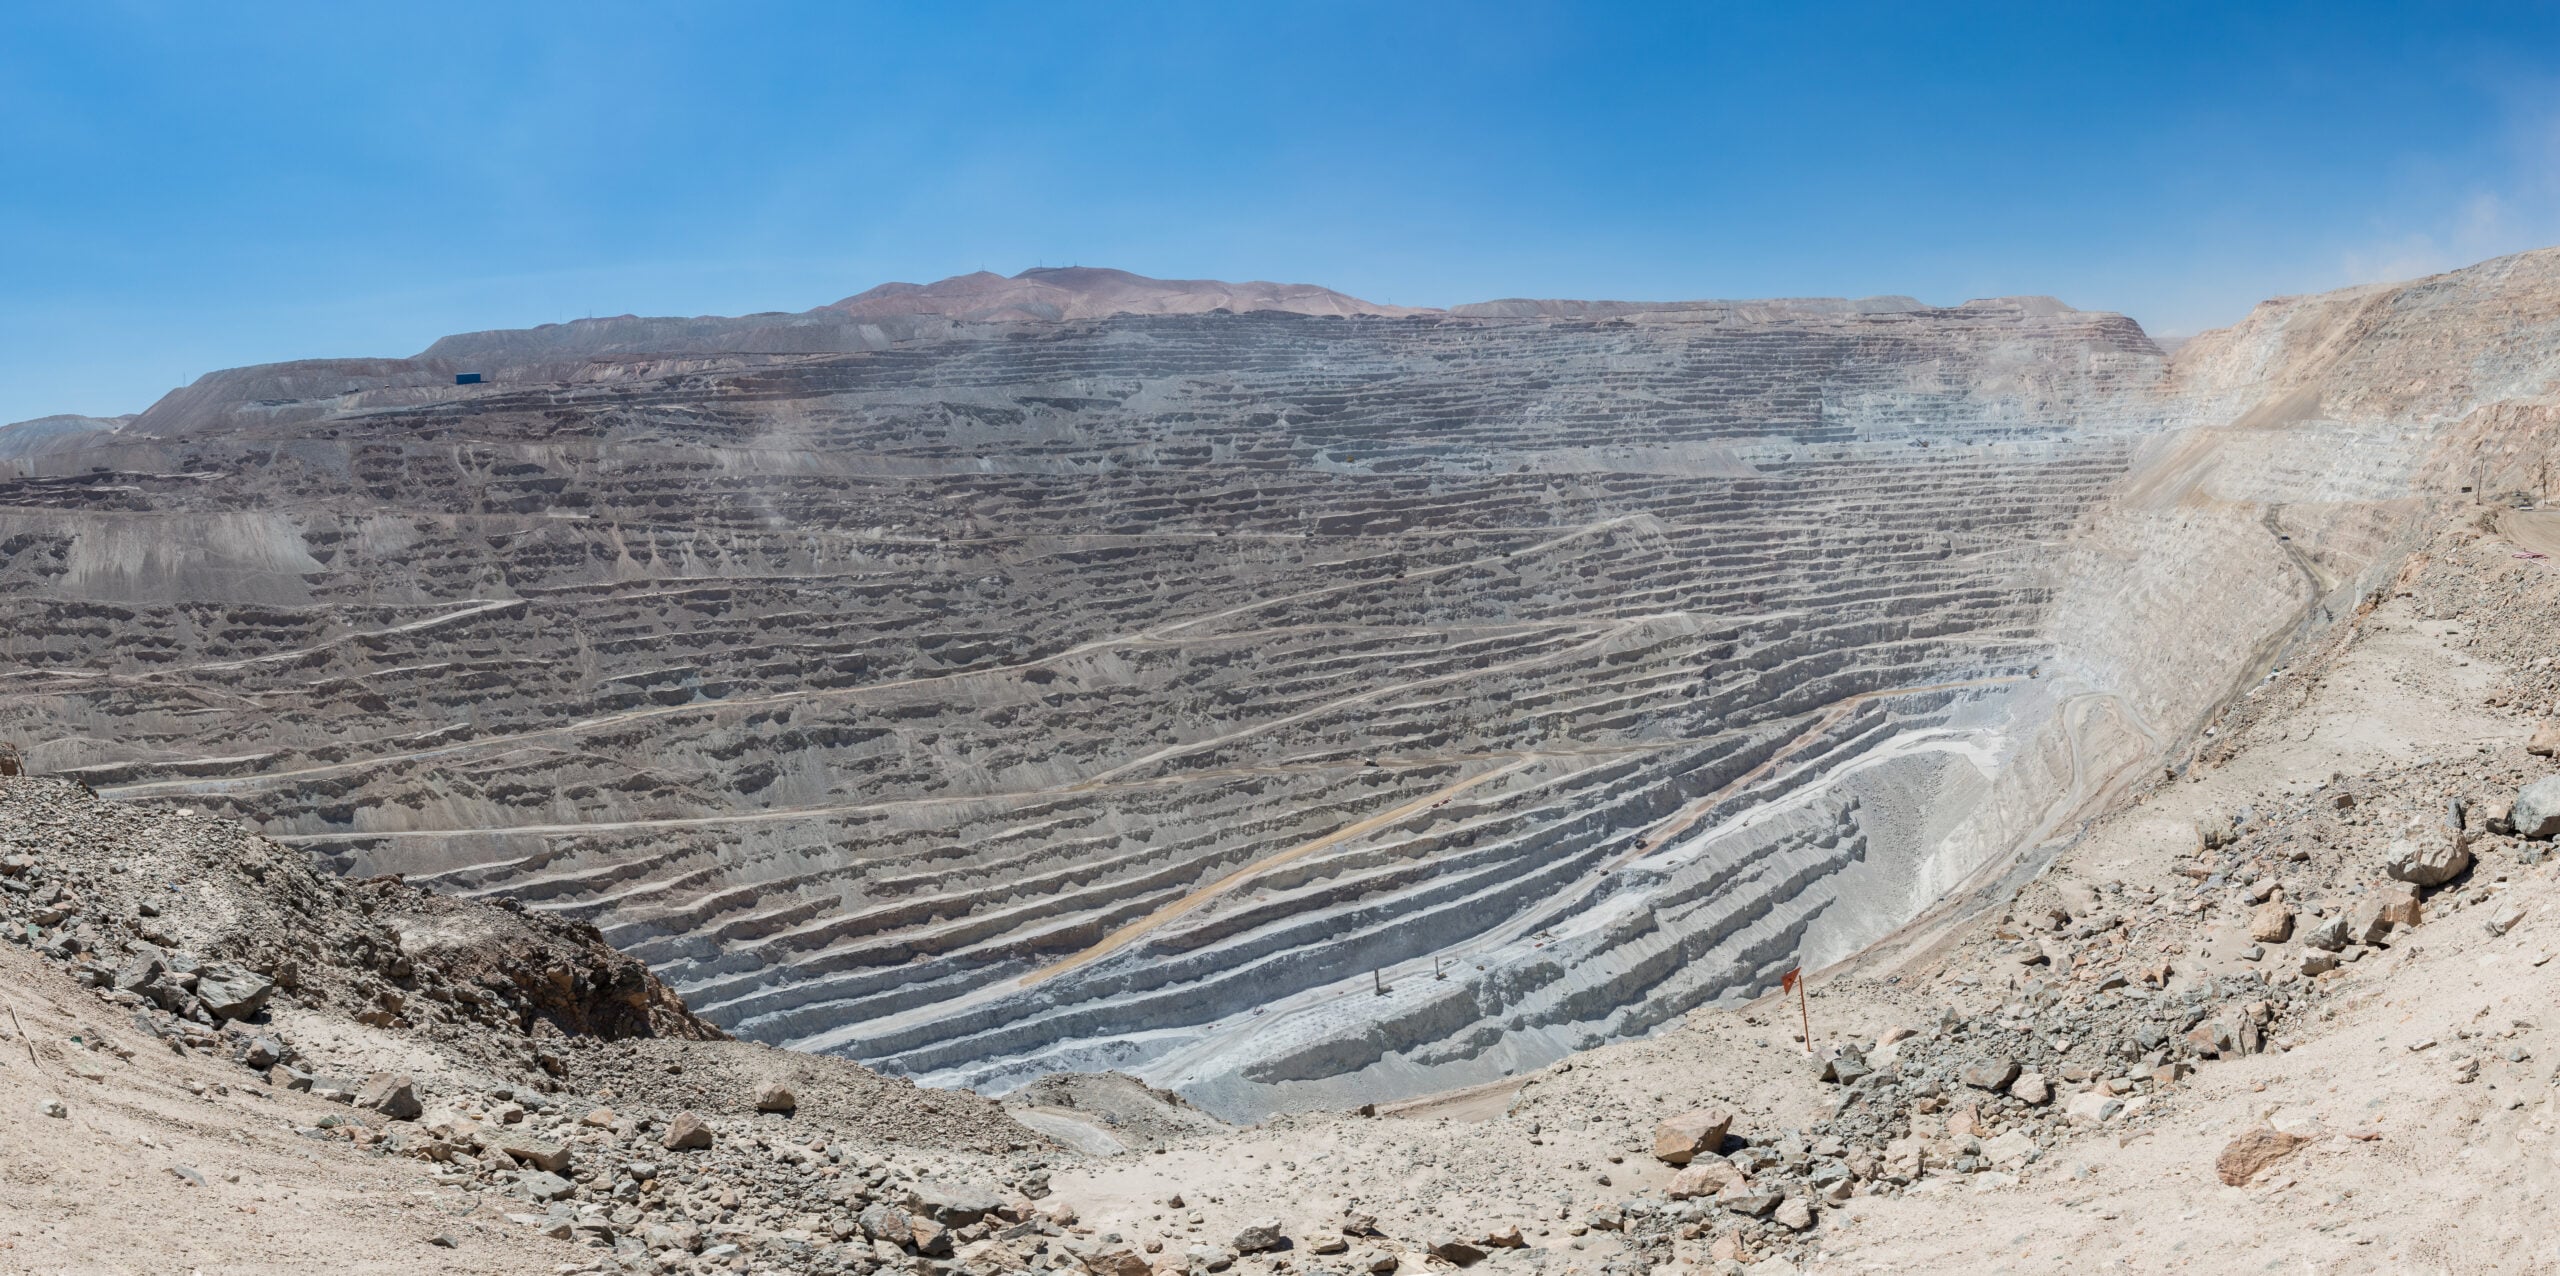
Where the Chile copper windfall comes from
Álvaro Merino, executive director of Núcleo Minero, puts each one-cent move in the annual average copper price at about US$120 million in extra exports and roughly US$60 million to the treasury, through private-mining tax and Codelco surpluses combined.
Chile’s 2026 budget was built on a reference price of US$4.38 a pound, set by the independent consultative committee. The year-to-date average is US$5.97. If the full-year average lands at US$6.00, the extra take works out at about US$9.7 billion. On a more conservative assumption of US$50 million per cent, it is closer to US$8.1 billion.
That is separate from a figure published in late July. The budget office projects large private mining will pay US$8,039 million in tax this year — a record, up 32 percent on 2025. That is a total, not an increase. Codelco transfers are forecast at US$3,188 million, up 58 percent in real terms.
Live Market IntelligenceChile — Live Market Board
Rio Times · Live Market Intelligence
Chile — Live Market Board
-1.30%
183,965.91
-0.99%
64,000.41
-0.43%
11,300.53
-1.30%
2,939,964
-1.00%
2,609.40
-0.12%
59,677.00
+0.43%
| Instrument | Last | Change | YoY | Prev. | High | Low | Volume |
|---|---|---|---|---|---|---|---|
| IPSA | 11,300.53 | -1.30% | — | 11,449.63 | 11,210 | 10,984 | 1,513,213,483 |
| USD/CLP | 913.98 | +0.04% | -5.67% | 913.65 | 915.11 | 906.68 | — |
| COPPER | 6.61 | +0.03% | +46.70% | 6.61 | 6.71 | 6.61 | 39,543 |
| SQM-B | 65,305 | -0.84% | +49.03% | 65,860 | 66,949 | 64,978 | 76,539 |
| COPEC | 5,964 | -1.09% | -11.70% | 6,030 | 6,100 | 5,960 | 634,331 |
| BSANTANDER | 78.37 | -2.28% | +35.94% | 80.20 | 81.69 | 78.34 | 36,288,711 |
| FALABELLA | 6,334 | -1.48% | +23.28% | 6,429 | 6,450 | 6,300 | 26,085,814 |
| ENELAM | 87.09 | +0.10% | -10.13% | 87.00 | 87.40 | 86.50 | 13,106,417 |
| CENCOSUD | 1,946 | -2.19% | -35.30% | 1,990 | 2,010 | 1,945 | 966,528 |
| CMPC | 1,020 | -1.96% | -29.10% | 1,040 | 1,050 | 1,015 | 3,526,677 |
| BANCO CHILE | 184.96 | -1.01% | +32.87% | 186.85 | 189.99 | 184.33 | 18,101,240 |
| LATAM AIR | 24.08 | -1.11% | +16.61% | 24.35 | 24.59 | 23.88 | 573,612,753 |
| SOUTHERN COPPER | 193.97 | -0.26% | +104.01% | 194.48 | 199.36 | 192.59 | 367,102 |
Why the price is running
The trigger came from central Africa. On Thursday Reuters obtained an order signed by three Congolese ministers banning exports of copper and cobalt concentrates outright. The Democratic Republic of Congo is the world’s second-largest copper supplier.
The market was already tight. LME warehouse stocks fell to 226,650 tonnes, the lowest since mid-February, with on-warrant availability down to 94,200 tonnes — barely a day of world consumption. COMEX September copper set a record of US$6.723 a pound on Thursday.
One point of care. Reuters places the all-time high on the LME three-month contract at US$14,527.50 on 29 January, so Thursday was a six-month high rather than a record. Cochilco logged a record close of US$6.55 a pound the same day, which fits if it is quoting the cash price.
The problem the windfall hides
None of this comes from digging up more copper. Cochilco expects 5.3 million tonnes in 2026, down 2 percent, after output fell about 9 percent year-on-year through May.
On the same day the price hit its six-month high, Codelco’s chairman was explaining why the state miner cannot keep up. Speaking at the Ecos de la Minería conference in Santiago, Bernardo Fontaine said the five-year investment plan is US$34 billion and there is “no possibility, obviously, of financing US$34 billion given the debt Codelco carries”. He added: “This plan is going to bring us four difficult years, difficult years in production.”
His numbers are stark. Comparing the last four years with the previous four: production down 16 percent, cost per tonne up 82 percent and debt up 50 percent, all with copper 30 percent more expensive. Codelco will review the pipeline project by project and may sell stakes it holds in private companies.
Chile is collecting a windfall built entirely on price while its largest single asset shrinks. That reverses when the price does.
What it means if you live in or invest in Chile
Copper was 50.1 percent of Chilean exports in the first half, US$30,236 million and up 11.5 percent. It is the main reason the peso sits near 913 to the dollar rather than well above 950 — so dollar earners lose a little purchasing power and peso earners get cheaper imports.
The budget effect is bigger. An extra US$8 to 9.7 billion turns a strained fiscal position into a manageable one, which changes the odds on tax rises and the pricing of Chilean sovereign bonds. The risk underneath it is the production line: a country earning more from selling less has a problem a good year in the metals market postpones rather than solves. This is general information, not investment advice.
More: Chile news in English, every day from The Rio Times.
Frequently Asked Questions
How big is the Chile copper windfall?
Núcleo Minero estimates about US$9.7 billion in extra fiscal revenue if the 2026 average price reaches US$6.00 a pound, against the budget assumption of US$4.38. A more conservative estimate is about US$8.1 billion.
Is that the same as the record US$8 billion from private mining?
No. The US$8,039 million is the budget office’s projection of total tax paid by large private mining in 2026. The windfall figure is the additional revenue above budget, and it includes Codelco surpluses.
Did copper hit an all-time high?
Not on the LME three-month contract. Reuters puts that record at US$14,527.50 on 29 January; Thursday’s US$14,369.50 was a six-month high. Cochilco recorded a record cash close of US$6.55 a pound.
Why did the price jump?
Reuters obtained a Congolese order banning exports of copper and cobalt concentrates, on top of the Grasberg suspension in Indonesia and exchange stocks at their lowest since February.
Sources: Cochilco; Banco Central de Chile; Dirección de Presupuestos; Diario Financiero; Reuters; Codelco.
This article was produced by The Rio Times’ automated newsroom system. How we use AI · Report an error
In depth
Read More from The Rio Times