Chile Supplies a Quarter of the World’s Copper. July Was a Bad Month.
Markets · Chile
Key Facts
- —The position Chile mined 23% of the world’s copper in 2024, more than any other country, per the US Geological Survey.
- —The warning Production fell 9.4% in July 2026 after deadly storms hit the northern mining belt.
- —The context Copper hit a record US$6.83 a pound in August 2026; it traded near US$6.56 on 4 September.
- —The catch July’s drop was weather, not a trend; storms interrupted mines, they did not destroy them.
- —The neighbours Peru supplies another 11.3% of world copper; together the two countries produce more than a third.
The energy transition runs on a red metal, and almost a quarter of it comes from one long, dry country. Chile’s copper story used to be about how much it produces; now it is about how hard producing it has become.
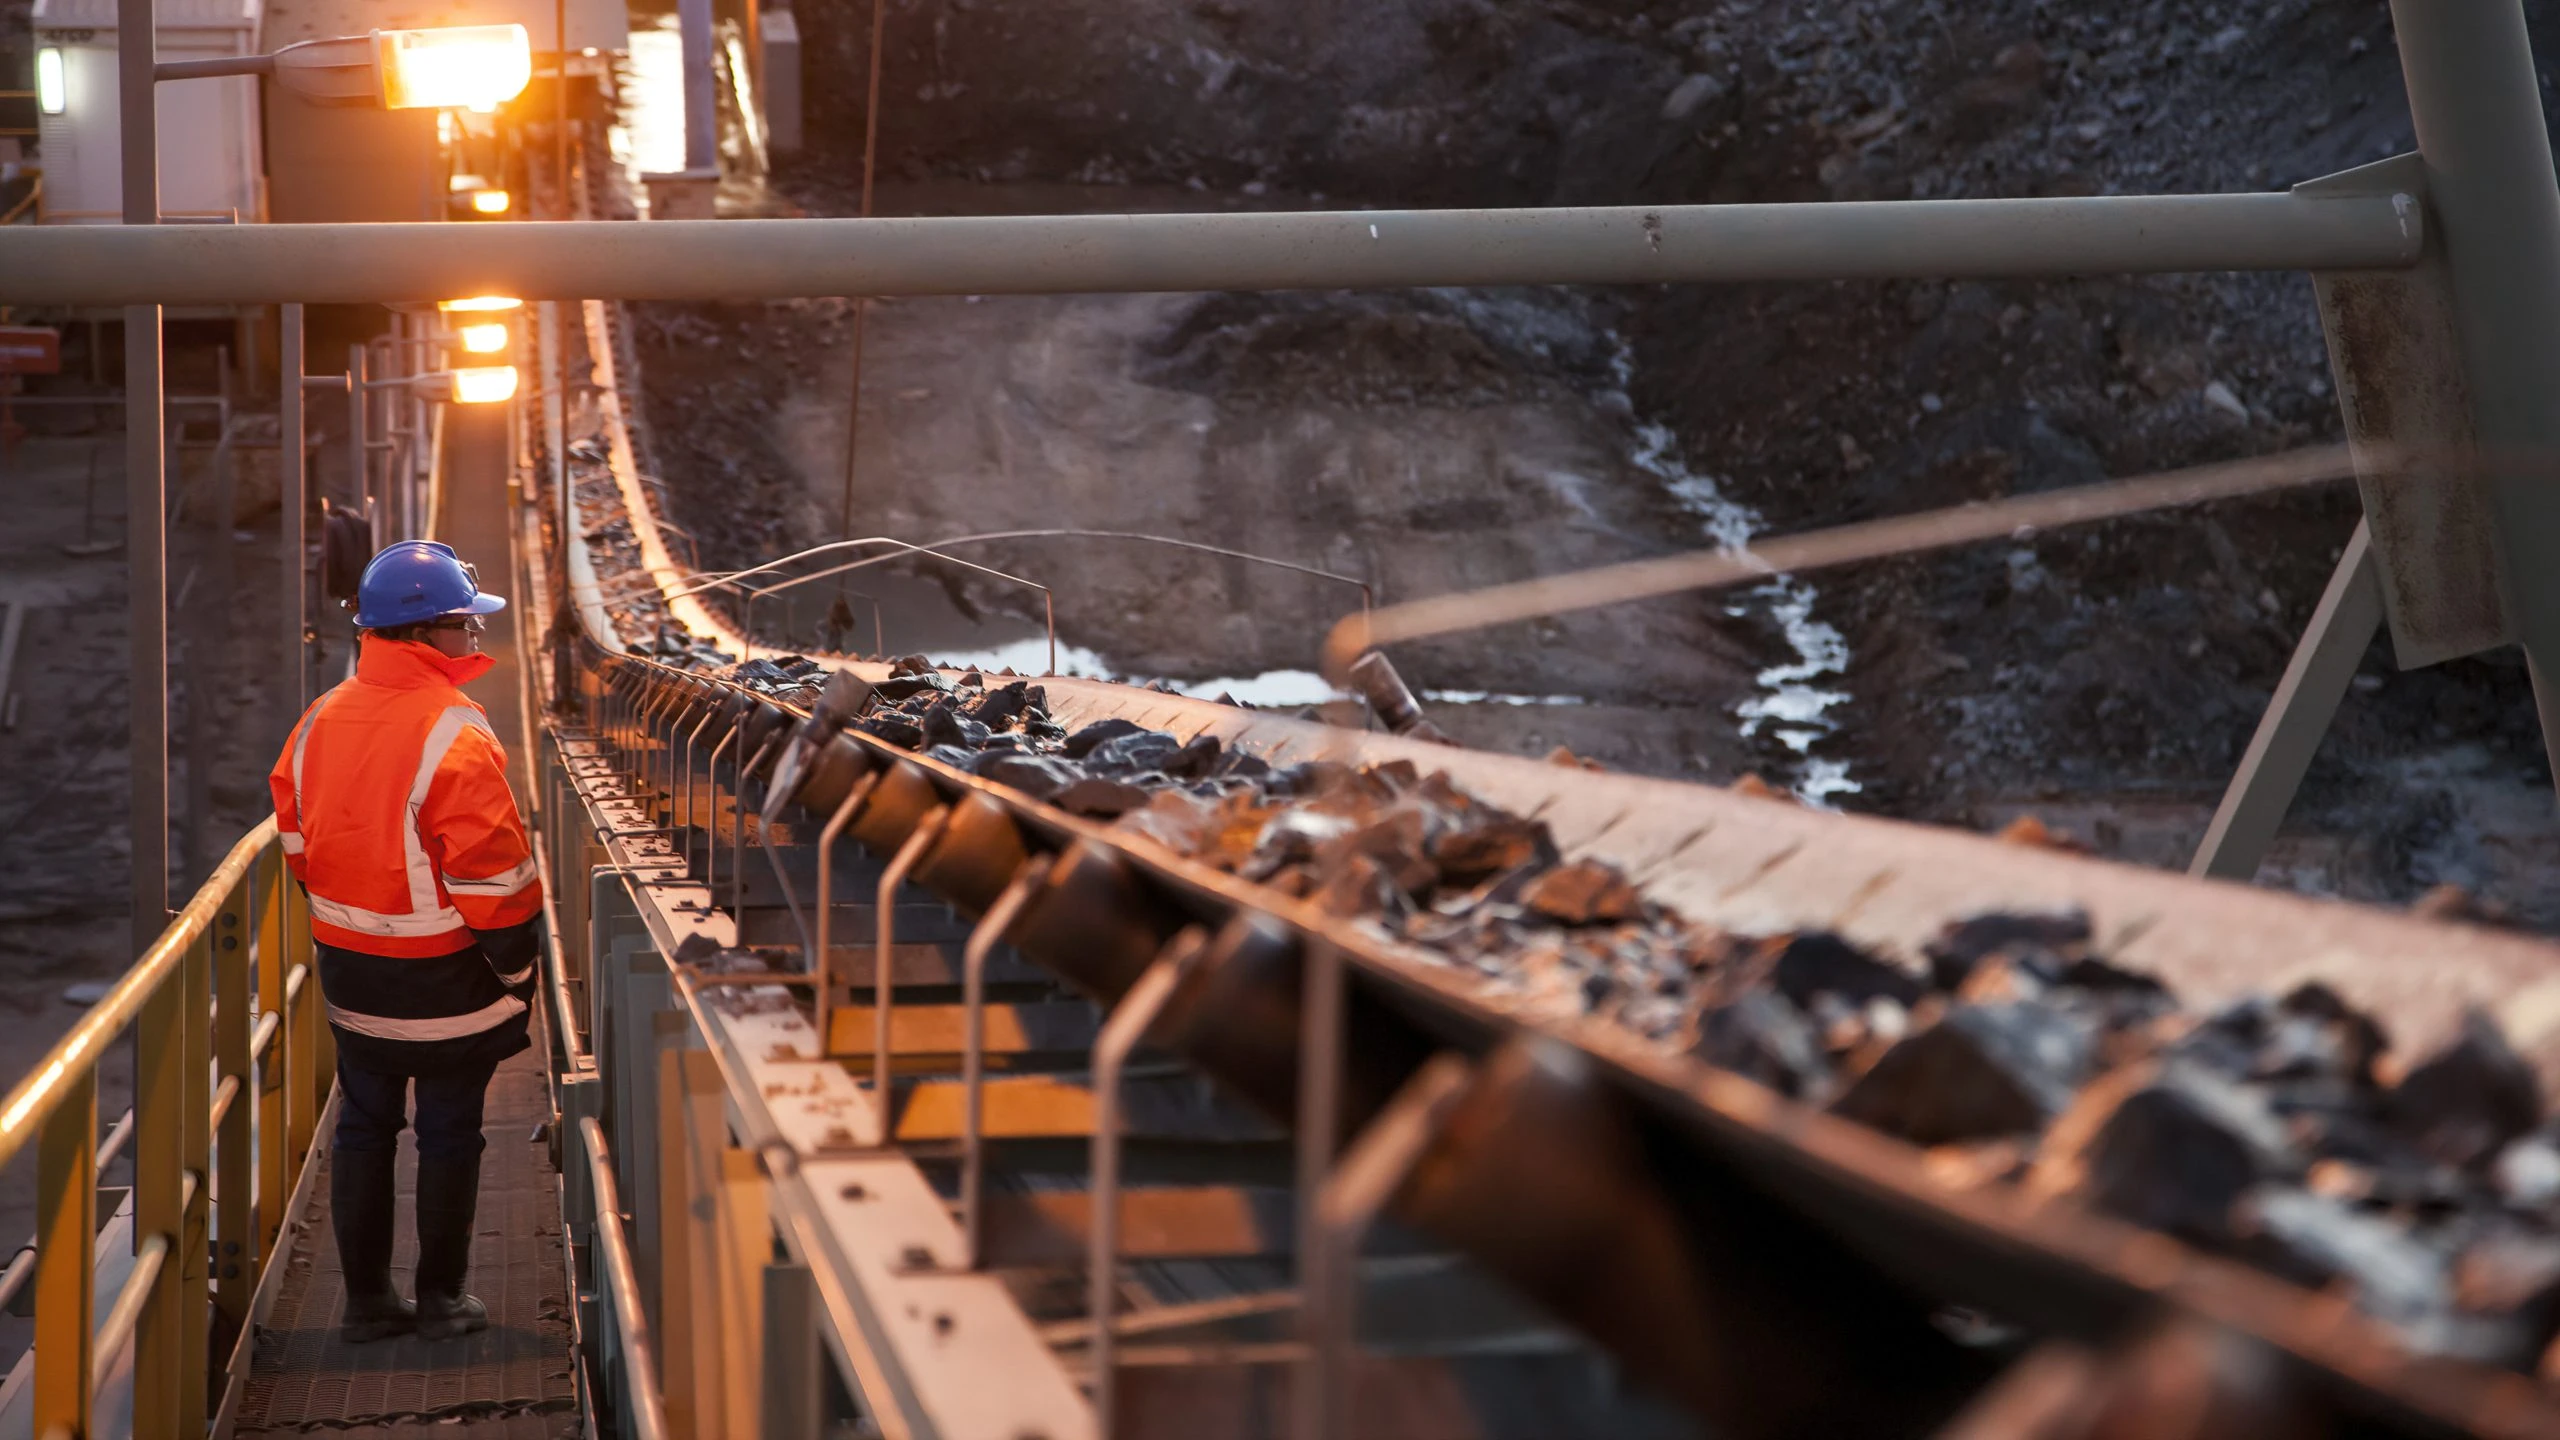
One storm season, global consequences
Chile’s national statistics institute, INE, reported July 2026 output of 403,424 tonnes, down 9.4% from 445,322 tonnes in July 2025. INE blamed severe weather in the north and routine maintenance at major mines.
At least 13 people died in the storms, and roads across northern Chile became impassable for days. With global inventories thin, a bad weather week in Chile now moves copper prices worldwide within hours.
The mine-by-mine damage
Codelco, the state mining giant, estimated losses near US$7.5 million a day at El Teniente during the worst of the stoppage. Antofagasta’s Los Pelambres mine halted mining and processing for several days.
Lundin Mining’s Caserones mine suspended operations after snow damaged power lines, with a full restart expected two to three weeks later. Teck’s Carmen de Andacollo plant shut on 17 July after access roads closed.
Escondida, the world’s biggest copper mine, was not reported among the storm-hit sites. BHP, its majority owner, instead blamed a separate 3% annual output drop on falling ore grades, the industry’s slower-moving problem.
Live Market IntelligenceChile — Live Market Board
Rio Times · Live Market Intelligence
Chile — Live Market Board
+0.02%
205,079.25
-0.17%
68,969.69
+0.06%
10,972.40
+0.02%
3,017,221
—
2,521.34
-1.75%
59,664.64
+0.40%
| Instrument | Last | Change | YoY | Prev. | High | Low | Volume |
|---|---|---|---|---|---|---|---|
| IPSA | 10,972.40 | +0.02% | — | 10,970.29 | 11,210 | 10,984 | 1,513,213,483 |
| USD/CLP | 913.98 | +0.04% | -5.67% | 913.65 | 915.11 | 906.68 | — |
| COPPER | 6.61 | +0.03% | +46.70% | 6.61 | 6.71 | 6.61 | 39,543 |
| SQM-B | 65,305 | -0.84% | +49.03% | 65,860 | 66,949 | 64,978 | 76,539 |
| COPEC | 5,964 | -1.09% | -11.70% | 6,030 | 6,100 | 5,960 | 634,331 |
| BSANTANDER | 78.37 | -2.28% | +35.94% | 80.20 | 81.69 | 78.34 | 36,288,711 |
| FALABELLA | 6,334 | -1.48% | +23.28% | 6,429 | 6,450 | 6,300 | 26,085,814 |
| ENELAM | 87.09 | +0.10% | -10.13% | 87.00 | 87.40 | 86.50 | 13,106,417 |
| CENCOSUD | 1,946 | -2.19% | -35.30% | 1,990 | 2,010 | 1,945 | 966,528 |
| CMPC | 1,020 | -1.96% | -29.10% | 1,040 | 1,050 | 1,015 | 3,526,677 |
| BANCO CHILE | 184.96 | -1.01% | +32.87% | 186.85 | 189.99 | 184.33 | 18,101,240 |
| LATAM AIR | 24.08 | -1.11% | +16.61% | 24.35 | 24.59 | 23.88 | 573,612,753 |
| SOUTHERN COPPER | 193.97 | -0.26% | +104.01% | 194.48 | 199.36 | 192.59 | 367,102 |
The geology problem
Chile’s great mines are old, and average ore grades have fallen for two decades. That means moving more rock, and using more energy and water, for the same tonne of metal.
Codelco carries the heaviest burden: its main mines need multi-billion-dollar projects just to hold output steady. Chile’s treasury also draws directly on Codelco’s earnings to fund public spending.
The demand side of the mountain
Electrification is arithmetic: electric vehicles, power grids, data centres and renewable energy all use far more copper than what they replaced. China still buys the largest share of Chilean output, though the customer base is broadening.
Supply cannot respond quickly, because a new mine takes roughly a decade from discovery to first production. That gap is why many analysts expect copper prices to stay high for years.
Peru, the quiet challenger
Peru produced 11.3% of the world’s copper in 2024, second only to Chile, according to the US Geological Survey. Its output has grown as Chile’s has stalled, and its government elected in 2026 is openly mining-friendly.
Together, Chile and Peru supply more than a third of the copper mined on Earth. For buyers, that concentration in two Andean countries is itself the risk to manage.
What to watch
Three numbers matter most: monthly output after the storm catch-up, Codelco’s investment approvals, and Chinese import volumes. All three are published regularly and can move prices on the day they land.
Chile’s copper century is not ending. It is getting more expensive, and so far the world has kept paying.
Water, energy and the desert
The Atacama is the driest desert on Earth. Mining there increasingly depends on desalination plants and pipelines stretching over a hundred kilometres.
Water rights, more than mineral rights, are becoming the real limit on new mines.
Power is a brighter story. Solar capacity in northern Chile has grown quickly, and new mining projects can now run mostly on renewable electricity.
Buyers increasingly ask about the carbon footprint behind their copper.
The price outlook, without the hype
Copper traded near US$6.56 a pound on 4 September 2026, down slightly from its all-time high of US$6.83 in August. Analysts expect prices to stay high but volatile, moving with Chinese construction data and US interest-rate expectations.
For Chile’s budget, every sustained dollar added to the copper price is worth billions in extra revenue. How much of a rally the finance ministry spends, rather than saves, is a domestic choice no storm controls.
The smelter gap
Chile exports most of its copper as concentrate, sending it to smelters abroad, mostly in Asia. In Santiago, officials debate whether to build more local smelting capacity and capture more value per tonne.
The alternative is to accept the trade-off and keep selling concentrate.
That choice means billions of dollars in capital and decades before it pays off. It is a decision about the shape of Chile’s mining industry for the rest of this century.
What buyers should understand
For manufacturers and investors, the lesson is concentration risk. When a country supplying nearly a quarter of world output has a bad storm week, prices can move before markets even open.
Contracts, inventories and hedging plans should be built around that reality. Chile’s supply is not always as steady as it looks.
Chile’s mining framework, built mainly in the early 1980s, has stayed stable for more than four decades. Contract stability is part of what buyers pay for when they choose Chilean copper.
The glossary of the trade
Ore grade is the share of copper in mined rock; lower grades mean digging more rock for the same tonne of metal. Concentrate is the partly processed product Chile ships to smelters in Asia for final refining.
Codelco is Chile’s state-owned mining company, and the world’s single largest copper producer. CPER is a US-listed exchange-traded fund that tracks copper prices and moves with news from Chile.
The project pipeline
Chile’s answer to falling ore grades is construction, not new discoveries. A queue of expansion projects at the largest northern mines aims to hold national output steady over the coming decade.
Codelco’s own projects, including converting open pits into underground mines, cost billions of dollars and take close to ten years to complete. These projects mainly exist to extend the life of very old deposits.
Private mines run a parallel pipeline, and their expansions increasingly depend on desalination plants and renewable power contracts. Permitting speed is the one lever Chile’s government fully controls, and every administration promises to shorten it.
More: Chile news in English, every day from The Rio Times.
The storm season’s ledger
July’s storms did not destroy Chile’s mining capacity; they interrupted it, flooding pits and closing haul roads. The 9.4% drop measures days lost, not mines lost, and later figures will show how much output was made up.
What will not return is the world’s margin for error, because global copper inventories remain thin. Every interrupted week now tightens a physical market that prices near-record highs even before accounting for weather.
The industry’s ledger has two columns. On one side: prices near records, demand from electrification, and margins that keep Chilean producers profitable even with rising costs.
On the other: ore grades falling a little further each decade, and desalinated water and renewable power adding real expense. Chile’s finance ministry, meanwhile, competes with schools and pensions for every peso copper brings in.
This storm season did not break Chile’s mining industry. But world copper supply is now so concentrated that one bad month in the Atacama raises costs for buyers everywhere.
That concentration is both Chile’s advantage and its burden.
Connected Coverage
Chile Copper Production Fell 9.4% in July After Storms
Copper Wrap: CPER Gains 1.18% on China Demand
More from the Chile section
The Big Picture
Markets & Finance — commodities coverage
Latest developments
- Chile Senator Bianchi Tells US Envoy to Leave on Sunday — 12 October 2026
- Chile’s El Teniente Avalanche Kills 2 Mine Workers — 12 October 2026
- Journalist Juan Pablo Cárdenas Dies at 76 — 11 October 2026
- Chile Inmate Aliste Vega Dies 6 Days After Pardon Plea — 11 October 2026
This article was produced by The Rio Times’ automated newsroom system. How we use AI · Report an error · Editorial responsibility: Matthias Camenzind, Editor-in-Chief
In depth
Expat Guide to Chile
What The Rio Times publishes for foreigners who live in or move to Chile.
Start here
- Chile Security and Crime Explained 2026
- Santiago Rent for Foreigners in 2026, US$422 to US$886
- Best Places to Live in Chile for Expats 2026
- Chile’s Rent Unit Rose 0.6% Before Inflation Data
City guides
Coming up in Chile
- Aitana in Santiago, Chile: Cuarto Azul World Tour at Movistar Arena on October 19, 2026 19 Oct
- Los Fabulosos Cadillacs Play Santiago on 29 October 29 Oct
- Foro de las Artes 2026 in Santiago, Chile: 30+ Free Events, 1–30 October 30 Oct
- Iron Maiden in Santiago, Chile: Two Estadio Nacional Nights, October 31 and November 1, 2026 31 Oct
Understand Chile
Copper in Latin America
- Copper in Latin America 2026: Mines, Prices and Politics
- What Is Codelco? Chile’s State Copper Giant, Its Debt and the El Teniente Crisis
- Peru Copper Mining Explained: Output, Big Mines, Exports and Risks in 2026
- Peru Natural Resources Explained 2026