Where Your Salary Goes Furthest: Buenos Aires, Montevideo or Santiago
Southern Cone · Cost of Living
Key Facts
- —What happened Santiago was cheapest relative to local pay in a Randstad study (5 August 2026) of three cities.
- —How big a jump Santiago’s rent-to-wage ratio dropped to 49% from 64%, solely due to Randstad’s 113% wage estimate hike (US$…).
- —The real story Santiago’s rent still takes 64% of a private-sector wage, so the affordability flip fails scrutiny.
- —The catch Randstad’s Uruguayan wage figure fell 40% in two years, below a Montevideo admin’s starting salary (US$…), so ratios are unreliable.
- —Who it touches For dollar earners, rents decide: Montevideo US$512, Buenos Aires US$578, Santiago US$713.
- —What comes next A laptop costs 111% of a month’s pay in Argentina versus 49% in Chile, a recurring cost outweighing rent ratios.
A staffing firm has just compared what a salary buys in the three southern-cone capitals. The answer is useful — but only once you know which of its numbers to trust.
If you are choosing between the three capitals of the southern cone, someone has finally done the arithmetic for you. Randstad, the staffing group, published a comparison on 5 August of what a local salary buys in Buenos Aires, Montevideo and Santiago. It is worth reading. It is also worth checking, because two of its headline findings come apart when you hold them against the national statistics offices — and the cost-of-living comparison between Buenos Aires, Montevideo and Santiago that survives is a different one from the one making the rounds.
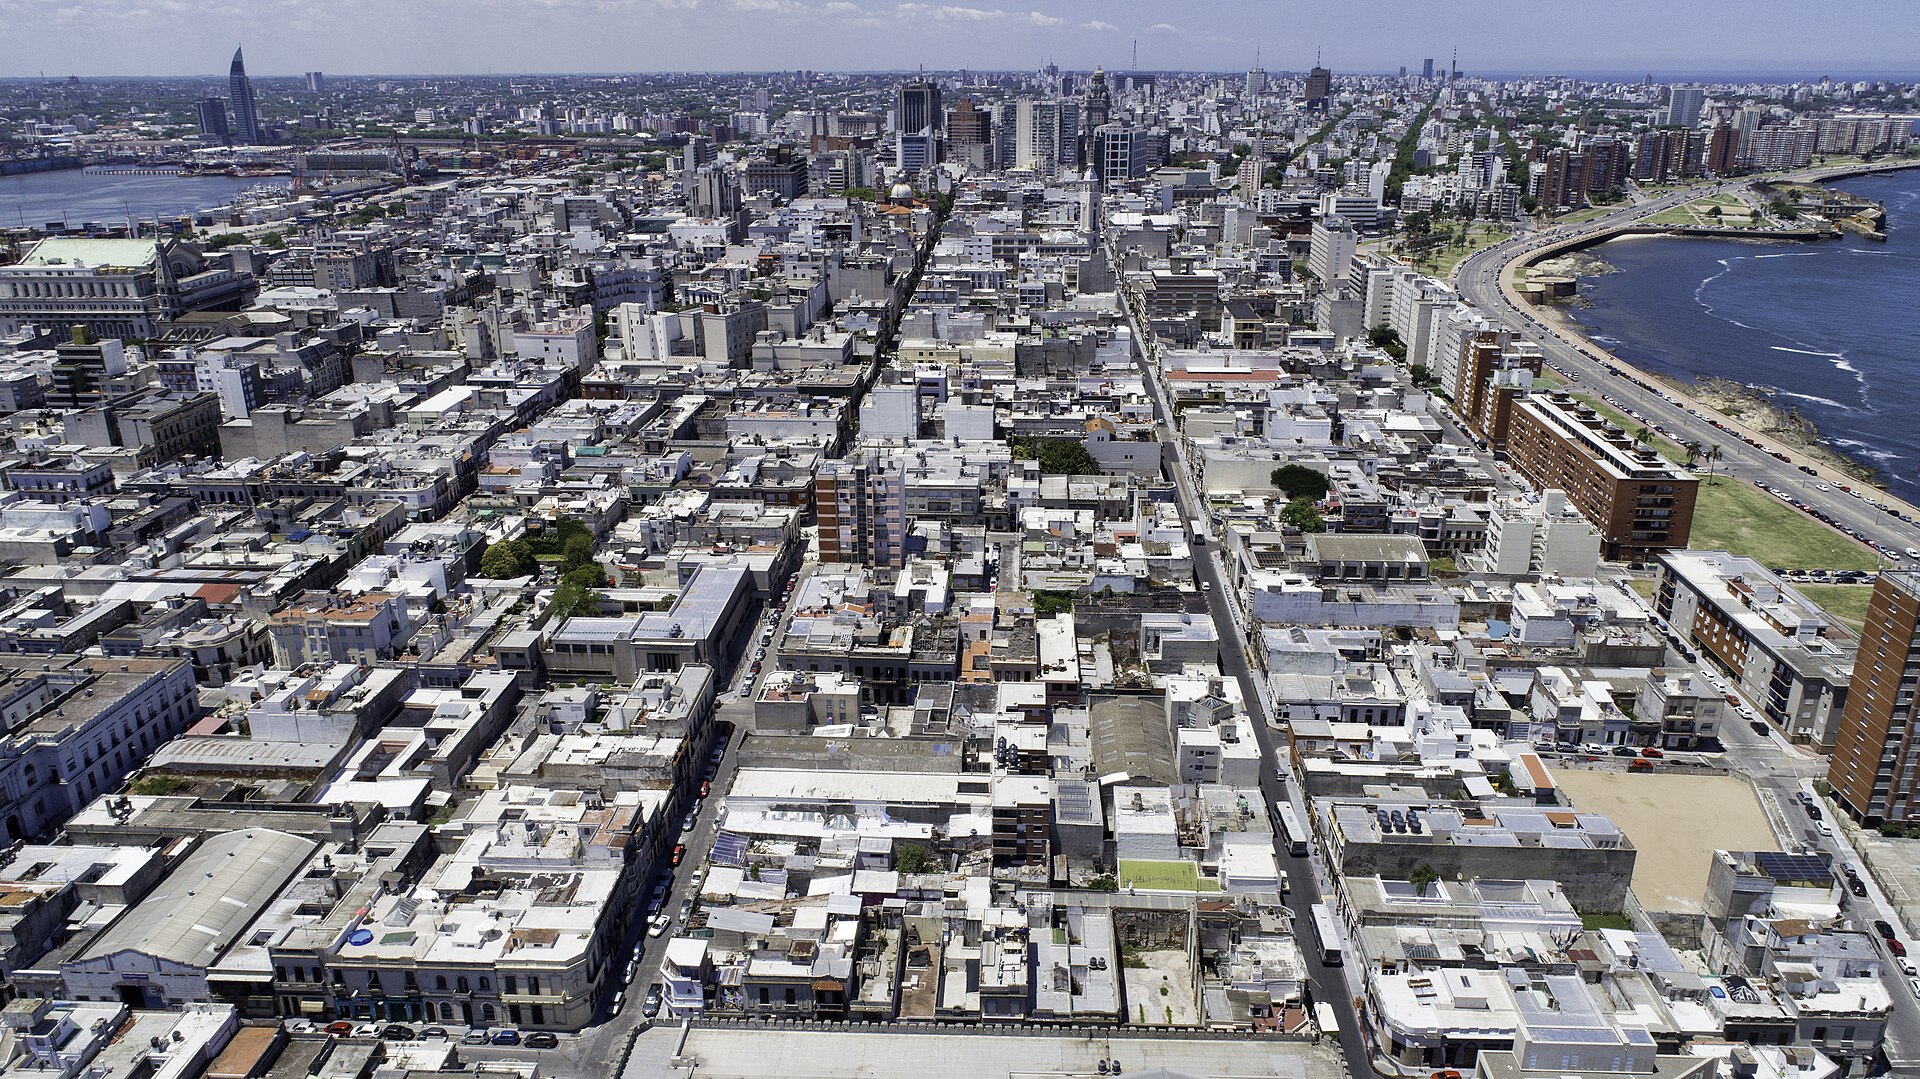
What the cost of living in Buenos Aires, Montevideo and Santiago actually looks like
Randstad divides a capital-city rent by a national wage figure and reports the share. On that measure Santiago looks lightest at 49%, Buenos Aires sits at 54% and Montevideo is heaviest at 59%.
The laptop comparison is the one that really separates the three. A mainstream machine — an i5 processor, 16 GB of memory, a 500 GB solid-state drive — costs about 1.8 million pesos in Argentina, which is 111% of the monthly reference wage. The same machine is 80% of a month’s pay in Uruguay and 49% in Chile. Randstad is explicit that the gap has survived the tax and tariff changes of recent years, so this is not simply an import-duty story any more.
Home internet follows the same order: 2.5% of the reference wage in Argentina, 2.38% in Uruguay, 0.75% in Chile. So does a Big Mac and so does a litre of regular petrol. On every everyday item, Santiago is cheapest relative to local pay, Buenos Aires is in the middle and Montevideo is dearest.
The number that changed is Randstad’s, not the market’s
The finding being repeated everywhere is that Santiago has flipped from the most expensive of the three to the least, falling from 64% of a wage two years ago to 49% now. That reads as a housing story. It is not one.
Santiago rents in Randstad’s own figures rose 63% over those two years, from 400,000 to 652,000 pesos. What fell was the denominator’s grip: Randstad’s Chilean reference wage went from 625,000 pesos to 1,333,905, a rise of 113% in a period when Chilean consumer prices rose by well under a tenth of that. Both figures are labelled in the documents as Randstad Chile’s own estimate.
Chile’s national statistics institute published its 2025 income survey in July. It puts average monthly labour income at 962,945 pesos, and the average for private-sector employees at 1,019,104. Divide Randstad’s 652,000 rent by that private-sector average and you get 64% — precisely where Randstad had Santiago two years ago.
So the honest version is: on the official income data, Santiago has not become the affordable one. Randstad revised its own estimate.
The Uruguayan wage does not hold up either
Randstad puts Uruguay’s average gross private-sector pay at 34,600 pesos a month. Four things sit awkwardly against that.
Its own 2024 edition said 58,075 — a 40% nominal fall in two years, in a country where the wage index has been rising about 5% a year. Uruguay’s minimum wage is 25,383 pesos, so an average of 34,600 would put the typical worker at 1.36 times the floor. And in the same 2026 document, Randstad quotes a Montevideo administrative employee’s starting gross at 35,000 pesos — higher than the national average it reports.
Because the Montevideo rent figure was cut by almost exactly the same proportion, the 59% ratio survives. Treat the ratio as indicative and the underlying pesos with care.
What actually holds, and what it means for you
Two things in the study are solid, and they are the two most useful to anyone deciding where to live.
The first is the equipment gap, and it is enormous. If your income depends on a working laptop and a working connection, Argentina charges you more than a month’s local pay for the machine and Chile charges you half that. For a remote worker replacing hardware every few years, that is a real and repeating cost, not a rounding error.
The second is the absolute rent, which matters more than any ratio if you are paid in dollars. Montevideo is the cheapest of the three at about US$512, Buenos Aires next at about US$578, and Santiago the most expensive at about US$713. That is the reverse of the ratio ranking, and it is the number that decides your month if your income does not come in pesos.
One caveat applies to all of it. Randstad divides capital-city rents by national wage figures, and all three capitals pay above their national averages. Every percentage in the study therefore overstates the burden on someone who actually lives in the city. And the Argentine wage is April 2026 data reported in July, so it lags a nominal reality that has moved since.
Reading the currency
The dollar figures here are converted at the rates prevailing on 18 August 2026: about 1,489 pesos to the dollar wholesale in Argentina, 40.05 in Uruguay and 914 in Chile.
The Argentine number needs one note. The gap between the official and parallel rates, which used to make any dollar comparison meaningless, is now about two per cent — the parallel rate is around 1,525 to 1,545. At that rate the Argentine figures come out roughly 4% cheaper in dollars, which does not change any of the rankings above.
More: Argentina news in English, every day from The Rio Times.
Frequently Asked Questions
Which of the three cities is cheapest to rent in?
In absolute dollars, Montevideo, at about US$512 a month for a two-room flat in a mid-range district, against about US$578 in Buenos Aires and about US$713 in Santiago. As a share of local pay the order reverses: Santiago is lightest at 49%, then Buenos Aires at 54%, then Montevideo at 59%.
Has Santiago really become more affordable?
Not on the official data. The fall from 64% to 49% of a wage comes from Randstad more than doubling its own Chilean wage estimate. Using Chile’s national statistics institute figure for average private-sector pay, Santiago’s rent is still about 64% of income.
Why is a laptop so much more expensive in Argentina?
It costs about 111% of a month’s gross reference pay in Argentina, against 80% in Uruguay and 49% in Chile. Randstad notes the gap has persisted despite the tax and tariff changes of recent years, so it is no longer only about import duties.
Are the wage figures comparable across the three countries?
Not exactly. The Argentine figure is a median gross wage from the labour secretariat’s SIPA report; the Uruguayan and Chilean figures are Randstad’s own estimates of an average. Medians and averages are not the same measure, and the study mixes them.
Which exchange rate do these dollar figures use?
The rates of 18 August 2026 — about 1,489 Argentine pesos, 40.05 Uruguayan pesos and 914 Chilean pesos to the dollar. Argentina’s parallel rate is about two per cent above the official one, which shifts the Argentine figures roughly 4% without changing any ranking.
When was the study published?
Randstad published it on 5 August 2026. An earlier edition, used here for the two-year comparison, was published on 1 August 2024.
Connected Coverage
Buenos Aires Salaries Rank Low as Rents Outpace Wages
The Cost of Living in Rio de Janeiro: What Foreigners Pay in 2026
Chile’s Economy Shrinks 0.2% as a Mining Slump Drags Down Growth
Orsi’s Divided Report Card: Why Uruguay’s Calm Politics Now Look Less Certain
Sources: Randstad — living and working in Montevideo, Santiago or Bue; INE Chile — Encuesta Suplementaria de Ingresos; El Cronista — where the salary goes furthest; El Observador — the salary and cost-of-living gap
This article was produced by The Rio Times’ automated AI newsroom. Editorial responsibility: Matthias Camenzind, Publisher and Editor-in-Chief. The Rio Times also runs Ask Rio Times, which answers from 100,000+ of our own articles, the daily Latin America Power Map, and prediction-market odds on elections and markets.. How we use AI · Report an error
The Buenos Aires Guide
What The Rio Times publishes for foreigners in Buenos Aires, Argentina.
This month
Coming up in Buenos Aires
- Paulo Londra Movistar Arena: Rapper Plays Buenos Aires, Argentina, on 28 November, Then Córdoba on 3 December 28 Nov
- Primavera Sound Buenos Aires 2026: Gorillaz, The Strokes to Headline 28 Nov
- Ed Sheeran Buenos Aires: Argentina Date at Estadio Huracán on 29 November, from ARS 125,000 (US$82) 29 Nov
- Ángela Torres Plays Buenos Aires on 8 and 9 December 9 Dec
Living in Buenos Aires
- Buenos Aires, Argentina Explained 2026
- Buenos Aires Tango Festival 2027: Dates, Mundial, Guide
- Milei Peso Policy Reshapes Cost of Living Buenos Aires for Expats
- Best Buenos Aires Neighborhoods for Expats
Understand Argentina