Costa Rica Population and Ethnic Groups Explained
COSTA RICA · PEOPLE
Key Facts
- Population 5,044,197 people in the official 2022 estimate; the World Bank puts the 2025 figure at 5.15 million.
- Age In 2022, 20.8% of people were under 15 and 10.1% were 65 or older.
- Ethnic groups In the 2011 census, 83.6% called themselves white or mestizo, 7.8% Afro-descendant and 2.4% indigenous.
- Newcomers Foreign-born residents were 12.2% of the population in 2024; Nicaraguans were three in four of them in 2011.
- Power Index Costa Rica ranks 9th of 14 in The Rio Times Latin America Power Index, with 36.5 points (October 2026 edition).
The Costa Rica population is about 5.15 million people, and it is older, more urban and more mixed than its size suggests. This guide explains who lives there, in plain numbers and plain English.
For US readers it matters because people born in the United States are the third-largest foreign group there.

Costa Rica Population in Numbers
The national statistics institute, known as INEC, counted a population of 5,044,197 for 2022. That is 50.2% women and 49.8% men, or 99 men for every 100 women.
The figure is an estimate and not a full headcount. INEC visited 1,550,258 homes between 8 June and 30 September 2022 and completed interviews in 1,074,002, so coverage was partial.
To fill the gaps, INEC built a statistical estimate of people and housing with national and international experts. The World Bank, a global lender that publishes country data, shows 5,152,950 people for 2025 (updated 8 October 2026).
Growth in the Costa Rica population has slowed sharply. The World Bank puts annual growth at 0.45% in 2025, against the 1.4% a year INEC measured between 2011 and 2022.
- 2011 census: 4,301,712 people, the last full headcount with ethnic data.
- 2022 estimate by INEC: 5,044,197 people.
- 2025 World Bank figure: 5,152,950 people.
- Density in 2022: about 99 people per square kilometre, up from 84 in 2011.
An Ageing Country With Few Babies
The Costa Rica population is getting older quickly. In 2022, INEC says, 10.1% of people were 65 or older, up from 5.6% in 2000.
The share of children under 15 fell from 31.9% in 2000 to 20.8% in 2022. People aged 15 to 64, the working years, made up 69.1%.
The cause is a very low birth rate and a long life. The World Bank shows 1.32 births per woman in 2024, well under the 2.1 needed to keep a population steady.
Life expectancy was 81.0 years in 2024, the World Bank says, against about 79 years in the 2011 census. The crude birth rate was 10.0 per 1,000 people and the death rate 5.6.
- Under 15: 20.8% (2022 estimate).
- Ages 15 to 64: 69.1% (2022 estimate).
- Ages 65 and over: 10.1% in 2022, and 12.8% in 2025 by World Bank data.
- Births per woman: 1.32 in 2024, down from about 1.8 in 2011.
Where Costa Ricans Live
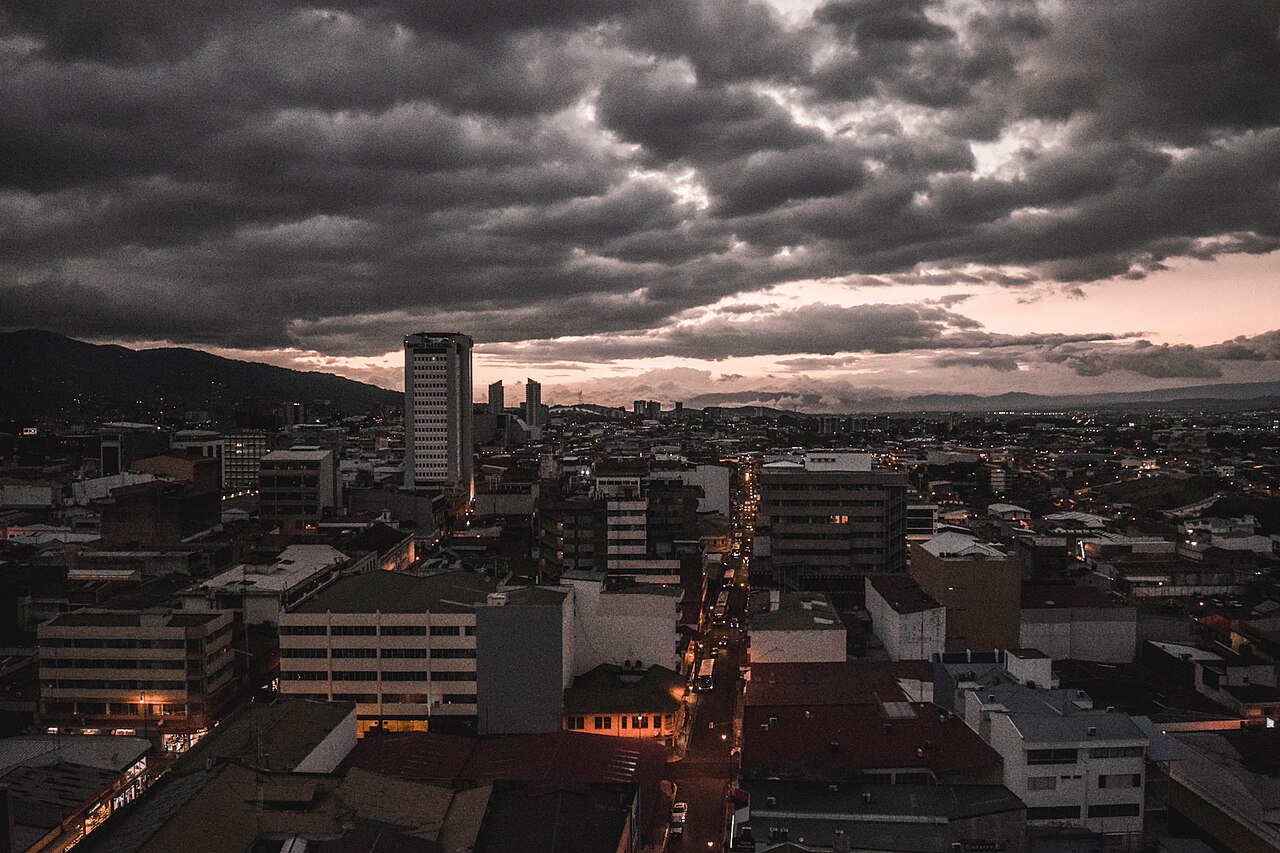
Most people live in the four central provinces of San José, Alajuela, Cartago and Heredia, which hold about 73% of the country. The province of San José holds 1,601,167 people, or 31.7% of the country, and Alajuela holds 1,035,466.
The other provinces are Cartago (545,092), Puntarenas (500,166), Heredia (479,117), Limón (470,383) and Guanacaste (412,808). The city of San José itself has 352,381 residents, 7.0% of the nation.
The fastest growth is on the coasts. Guanacaste, in the Pacific north-west, grew 2.12% a year between 2011 and 2022, and Puntarenas grew 1.79%.
Among the 82 cantons, as local districts are called, Talamanca grew fastest at 4.23% a year. Garabito followed at 3.97%.
About four in five people in Costa Rica live in towns and cities. The World Bank puts the urban share of the population at 79.7% in 2025, up from 72.8% in the 2011 census.
Our Costa Rica country guide gives the basics. The Costa Rica hub holds the wider coverage.
The Main Ethnic Groups in Plain English
The latest ethnic breakdown we could confirm is the 2011 census, when people chose their own label. The 2022 estimate report carries no such table.
Mestizo means a person of mixed Spanish and indigenous ancestry. Most people place themselves in that group or call themselves white, and the census counts the two together.
- White or mestizo: 3,597,847 people, or 83.6%.
- Mulato (mixed African and other ancestry): 289,209 people, or 6.7%.
- Black or Afro-descendant: 45,228 people, or 1.1%.
- Indigenous: 104,143 people, or 2.4%.
- Chinese: 9,170 people, or 0.2%.
- Another group: 36,334 people, or 0.8%. No group: 124,641, or 2.9%. Not stated: 95,140, or 2.2%.
Indigenous Peoples and Their Territories
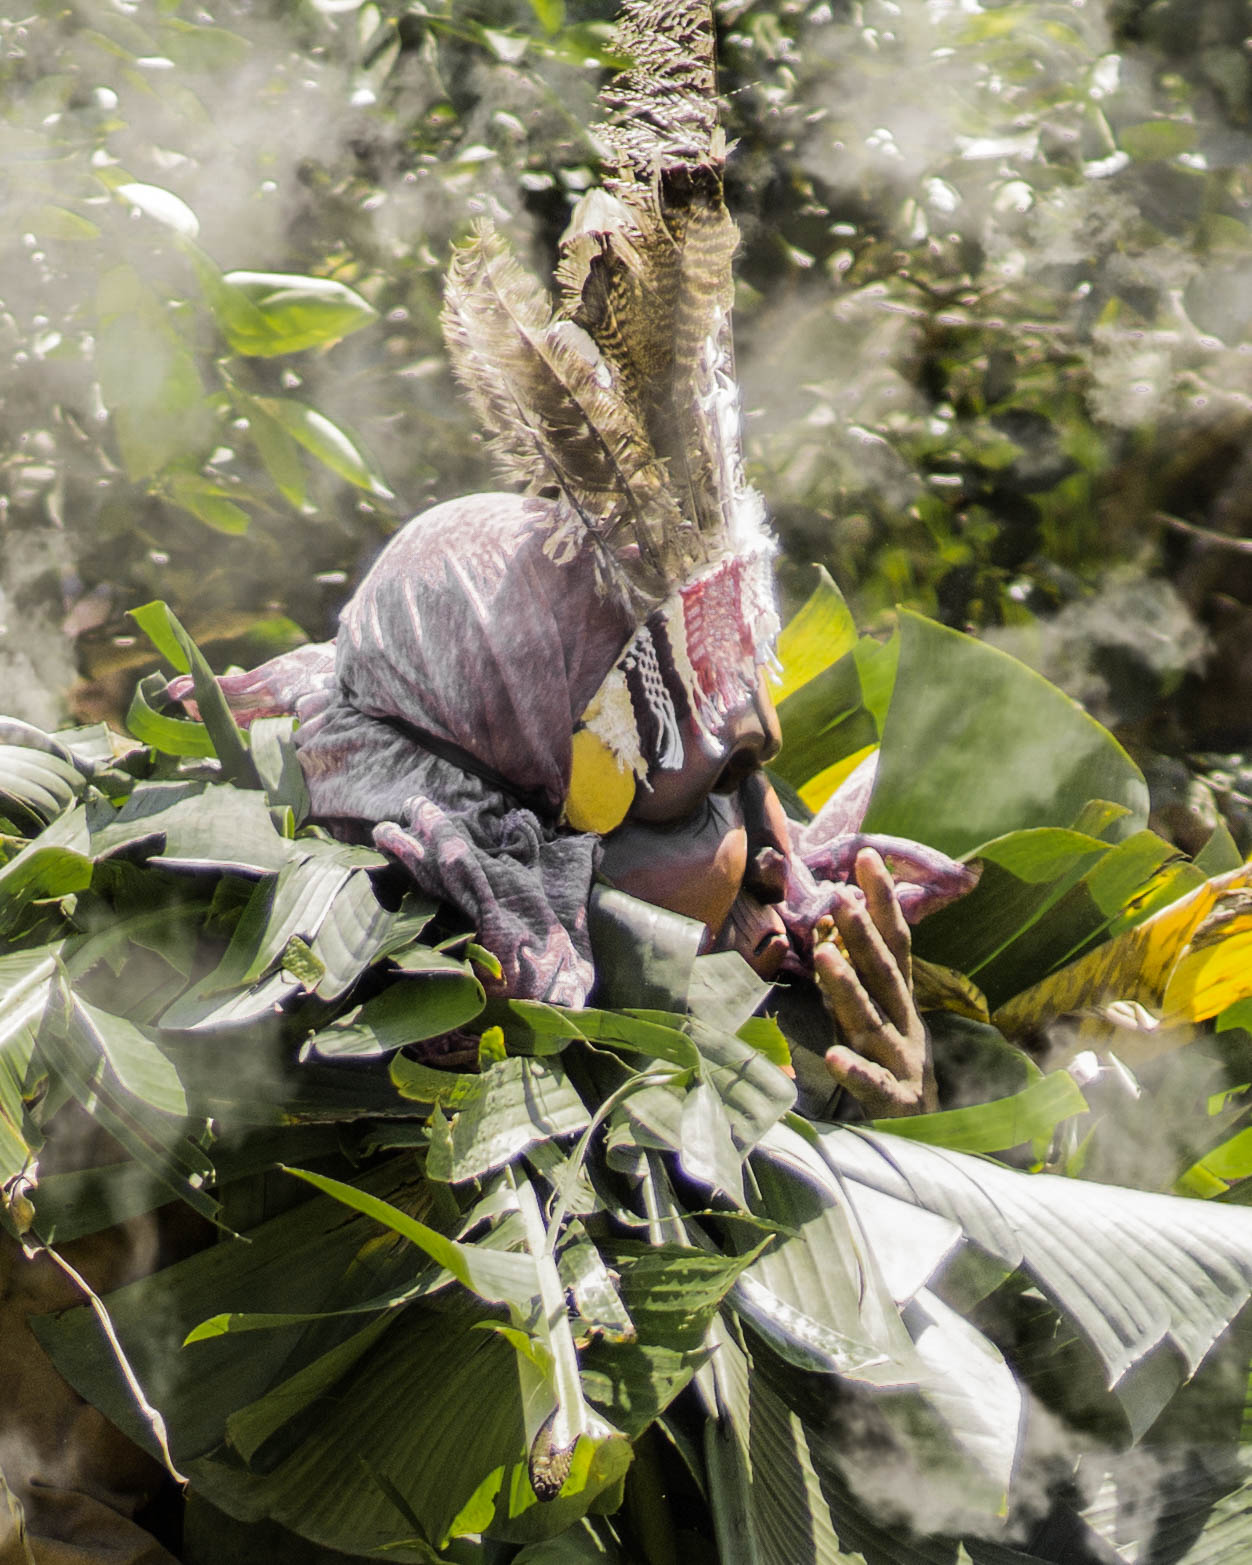
In 2011, 104,143 people called themselves indigenous, and 78,073 of them named a specific people. INEC’s 2011 census report covers 24 indigenous territories.
The biggest peoples were the Bribri (18,198) and the Cabécar (16,985). Next came the Chorotega (11,442), mostly in Guanacaste, and the Ngäbe (9,543).
Smaller groups include the Brunca or Boruca (5,555), the Huetar (3,461), the Térraba (2,665) and the Maleku (1,780). Another 8,444 belong to a people from outside Costa Rica, and 26,070 named none.
Limón had the most indigenous residents, 27,462, followed by Puntarenas with 25,316. Guanacaste had 10,135, of whom 7,991 were Chorotega.
Indigenous residents are a small share of the national total. They are a larger share in Limón (7.1%) and Puntarenas (6.2%).
Afro-Costa Ricans and the Caribbean Coast
In 2011, 45,228 people called themselves black or Afro-descendant and 289,209 called themselves mulato. Together that is 334,437 people, or 7.8%, the share the Costa Rican courts cite for Afro-descendants.
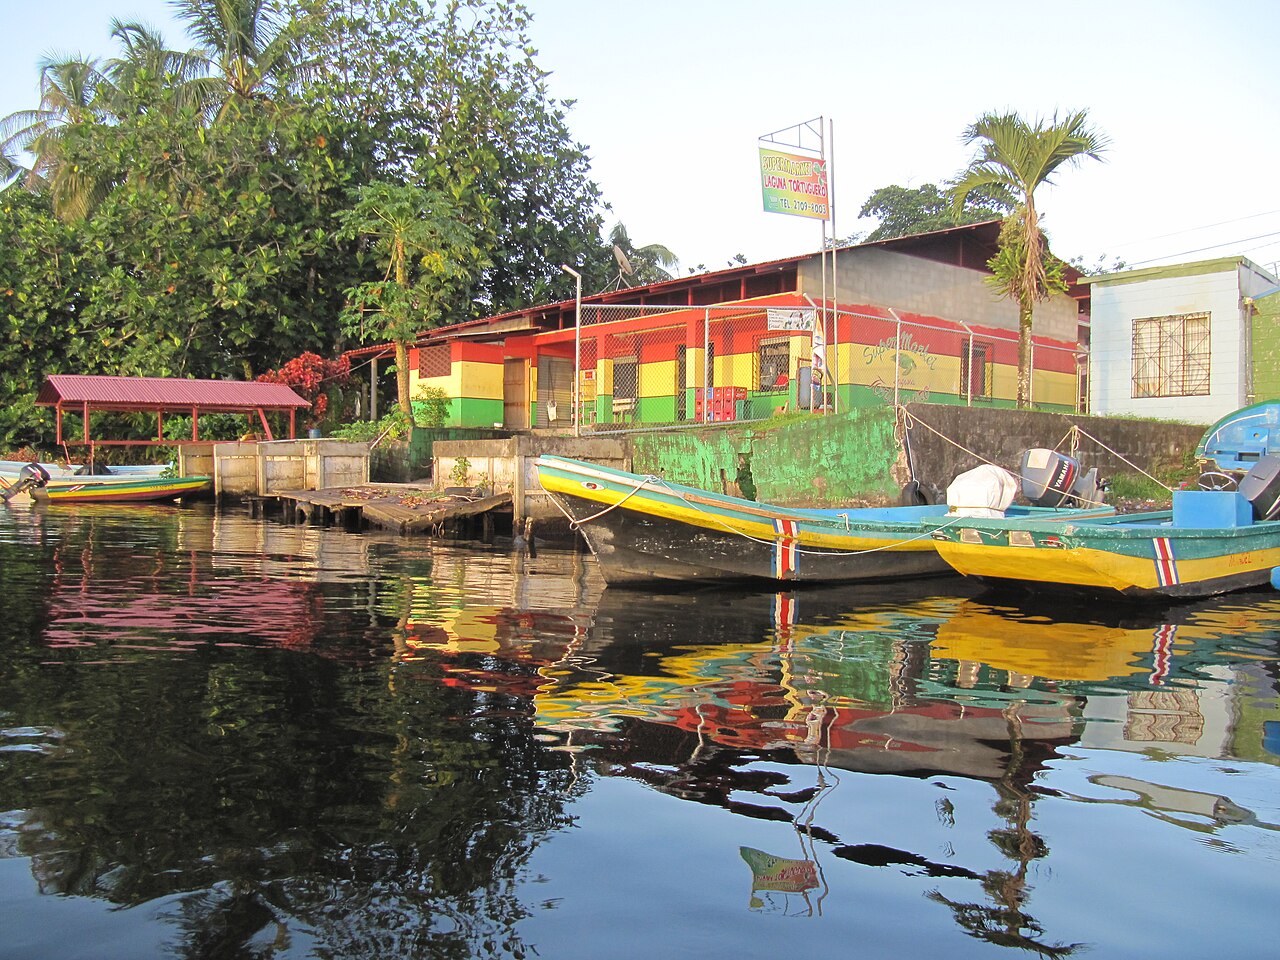
Limón province, on the Caribbean coast, has the highest Afro-descendant share of any province, with 51,344 Afro-descendants, or 13.3% of its people.The largest number, however, lives in the capital province.San José had 105,981 Afro-descendants in 2011, followed by Alajuela with 52,617.A 2015 judiciary circular, using UN figures from the 2011 census, found more hardship among Afro-descendants.Extreme poverty reached 8.5% of Afro-descendant households against 5.0% for white or mestizo households.Fewer Afro-descendants held top jobs: 8.1% of management posts, against 15.0% for white or mestizo workers.Access to social insurance was also lower, with 18.7% uncovered against 13.8%.
Immigrants, Nicaraguans and the Wider Diaspora
Costa Rica is a country that receives migrants. The 2011 census counted 385,899 foreign-born residents, 9.0% of the population, and the World Bank shows 628,404, or 12.2%, for 2024.
Nicaraguans are by far the largest group, with 287,766 people in 2011, or 74.6% of all foreign-born residents. Colombians came second, with 16,514 people.
People born in the United States were the third largest group in 2011, with 15,898. Panamanians (11,250) and Salvadorans (9,424) followed.
Money also flows in. Costa Rica received about US$846 million in remittances in 2025, equal to 0.8% of its economy, according to World Bank data.
Current figures for Costa Ricans living abroad, including in the United States, are not in the sources we checked. The Costa Rica population figures above count residents only.
Foreign money and companies are covered in foreign powers and investors in Costa Rica. Regional ties are in Costa Rica’s role in Latin America.
Language, Faith and Living Together
Spanish is the official language, and the Constitution (Article 76) tells the state to protect the national indigenous languages. Article 33 says all persons are equal before the law and bars discrimination against human dignity.
Under Article 75 the Catholic religion is the state religion, and the same article protects the free exercise of other beliefs. Article 19 gives foreigners the same individual and social rights as Costa Ricans, with limits set by law.
The law is open on paper. The 2011 census shows gaps in jobs, poverty and insurance between Afro-descendants and the white or mestizo majority.
Roughly one person in eleven was born abroad in 2011, and the World Bank puts the share at 12.2% in 2024. Living together therefore means sharing schools, clinics and workplaces across many backgrounds.
Our piece on people and culture in Costa Rica covers daily life. The country’s economy and farming are covered in a guide to San Carlos.
What It Means for US Readers
An older Costa Rica population means a growing share of people at pension and health-care age. The province of San José alone holds 31.7% of all residents.
Spanish is the language of daily life, and people born in the United States were the third largest foreign group in 2011. Travellers to Limón or the indigenous territories will meet communities with their own histories, so check local guidance before visiting.
What Is Not Known
INEC has published no ethnic or religion breakdown from the 2022 work, so the 2011 shares are the latest on record. How many people would call themselves indigenous or Afro-descendant as of October 2026 is not public.
The 2022 numbers are an estimate built after a partial census. Official counts of people born abroad and of Costa Ricans living in the United States are not in the documents we reviewed.
Frequently Asked Questions
What is the population of Costa Rica?
INEC’s official estimate is 5,044,197 people for 2022. The World Bank shows 5,152,950 for 2025, in data updated on 8 October 2026.
What are the main ethnic groups in Costa Rica?
In the 2011 census, 83.6% called themselves white or mestizo. Afro-descendants made up 7.8%, indigenous people 2.4% and Chinese 0.2%.
How many indigenous people live in Costa Rica?
The 2011 census counted 104,143 people, or 2.4%. The biggest peoples are the Bribri, Cabécar and Chorotega, living in 24 indigenous territories.
How many foreigners live in Costa Rica?
The World Bank shows 628,404 foreign-born residents in 2024, or 12.2%. In 2011, Nicaraguans were 74.6% of that group.
What language do people speak in Costa Rica?
Spanish is the official language. The Constitution also tells the state to protect the country’s national indigenous languages.
Is Costa Rica’s population getting older?
Yes. People aged 65 and over were 10.1% in 2022 against 5.6% in 2000, and women have 1.32 children on average.
Sources: INEC, press release on the Population and Housing Estimate 2022, 20 Jul 2023; INEC, Estimation of Population and Housing 2022, general results, Jul 2023; INEC, Census 2011 general results, 2011; INEC and CELADE, Indigenous territories, Census 2011, 2011; World Bank, World Development Indicators for Costa Rica, 8 Oct 2026; Costa Rican judiciary, Circular 176-2015 on access to justice for Afro-descendants, 2015; Political Constitution of Costa Rica, Articles 19, 33, 75 and 76, 29 Oct 2026.
This article was produced by The Rio Times’ automated newsroom system. How we use AI · Report an error · Editorial responsibility: Matthias Camenzind, Editor-in-Chief
Expat Guide to Costa Rica
What The Rio Times publishes for foreigners who live in or move to Costa Rica.
Start here
- Fer De Lance Snake Facts and Safety Tips
- Best Places to Live in Costa Rica for Expats 2026
- Costa Rica Income Tax Bill Would Charge Residents 15% on Five Kinds of Foreign Investment Income
- Costa Rica Permanent Residency and Citizenship: How the Rules Work
City guides
Coming up in Costa Rica
- Ozuna Plays Costa Rica on 31 October 31 Oct
- Alejandro Sanz Plays Costa Rica on 7 November 2026 7 Nov
- Soda Stereo Costa Rica Tickets From US$93 11 Nov
- Cazzu Plays Alajuela, Costa Rica, on 12 November 2026 12 Nov
Understand Costa Rica
Brazil runoff date: Sunday, October 25, poll closing times and when results start · Brazil runoff polls: Flávio 51%, Lula 49% · Kalshi and Polymarket odds
Rotate for Best Experience
This report is optimized for landscape viewing. Rotate your phone for the full experience.
You've reached your free article limit
Subscribe to The Rio Times for unlimited access to our news, expat and nomad guides and market intelligence on Latin America and Africa.
Keep reading for free
Your first article was on us. Register with your email address to read 6 free articles every month. You will also receive The LatAm Brief: what moved in Latin American markets, politics and expat life, every weekday morning.
Expat Guide to Costa Rica
What The Rio Times publishes for foreigners who live in or move to Costa Rica.
Start here
- Fer De Lance Snake Facts and Safety Tips
- Best Places to Live in Costa Rica for Expats 2026
- Costa Rica Income Tax Bill Would Charge Residents 15% on Five Kinds of Foreign Investment Income
- Costa Rica Permanent Residency and Citizenship: How the Rules Work
City guides
Coming up in Costa Rica
- Ozuna Plays Costa Rica on 31 October 31 Oct
- Alejandro Sanz Plays Costa Rica on 7 November 2026 7 Nov
- Soda Stereo Costa Rica Tickets From US$93 11 Nov
- Cazzu Plays Alajuela, Costa Rica, on 12 November 2026 12 Nov
Understand Costa Rica