IBOV 176,670.20 ▲ 0.76% IPSA 10,838.27 ▼ 1.15% IPC MEX 67,183.26 ▲ 1.20% MERVAL 3,250,903 ▼ 1.65% COLCAP 2,291.28 ▲ 0.37% BVL PERÚ 57,237.60 — — USD/BRL5.12▲ 0.04% USD/MXN17.43▼ 0.11% USD/CLP931.47▼ 0.89% USD/COP3,202▼ 0.48% USD/PEN3.40▼ 0.05% USD/ARS1,500▲ 0.17% USD/UYU40.20▲ 1.42% USD/PYG6,020▲ 1.46% USD/BOB11.30▲ 3.36% USD/DOP57.82▲ 0.47% USD/CRC449.99▲ 1.60% USD/GTQ7.62▲ 2.22% USD/HNL26.76▲ 1.54% USD/NIO36.62▲ 0.69% USD/VES740.95▼ 0.05% USD/PAB1.00— 0.00% USD/BZD2.00— 0.00% USD/JMD157.19▲ 0.07% USD/TTD6.75▲ 1.25% EUR/BRL5.83▲ 0.76% BRENT 84.04 ▼ 4.89% WTI 79.20 ▼ 4.13% IRON ORE 161.91 — — COPPER 6.34 ▼ 0.06% GOLD 4,024 ▼ 1.24% SILVER 57.38 ▼ 1.87% SOY 1,220 ▲ 0.93% CORN 481.00 ▲ 6.47% WHEAT 664.75 ▲ 0.72% COFFEE 340.50 ▲ 4.91% SUGAR 14.56 ▼ 0.14% ORANGE JUICE 136.30 ▼ 3.64% COTTON 81.08 ▲ 2.19% COCOA 5,206 ▲ 2.08% BEEF 221.78 ▼ 1.53% CATTLE 336.85 ▼ 0.41% LITHIUM 66.93 ▼ 2.48% PETR4 41.17 ▲ 0.39% VALE3 75.47 ▼ 0.29% ITUB4 42.82 ▲ 0.30% BBDC4 18.78 ▲ 0.37% ABEV3 16.07 ▲ 1.32% BBAS3 20.74 ▲ 1.17% B3SA3 16.08 ▲ 2.29% WEGE3 46.56 ▲ 0.34% PRIO3 56.55 ▲ 1.51% SUZB3 42.89 ▲ 2.44% RENT3 38.23 ▲ 1.35% AZZA3 17.22 ▲ 0.64% CSAN3 3.99 ▲ 1.01% RAIZ4 0.26 — 0.00% PCAR3 2.78 ▲ 1.46% GMAT3 3.93 ▲ 2.61% PSSA3 54.91 ▲ 1.14% CVCB3 1.31 ▼ 3.68% POSI3 3.57 ▲ 1.42% SLCE3 13.21 ▼ 1.27% NATU3 8.44 ▼ 0.59% BRKM5 6.02 ▼ 0.99% RANI3 8.13 ▲ 2.52% CSNA3 5.59 ▼ 2.10% CMIN3 5.90 ▲ 1.72% USIM5 8.65 ▲ 0.46% GGBR4 25.14 ▲ 2.70% ENEV3 25.85 ▲ 1.49% CPFE3 45.78 ▲ 2.30% CMIG4 11.16 ▼ 0.09% EQTL3 38.97 ▲ 0.44% LREN3 13.92 ▲ 1.38% VIVT3 33.87 ▼ 6.20% RAIL3 14.04 ▲ 1.74% KLABIN 18.12 ▲ 2.49% RAIA DROGASIL 18.14 ▼ 0.17% RDOR3 34.41 ▲ 2.41% HAPV3 10.60 ▲ 4.02% FLRY3 16.98 ▲ 2.72% SMTO3 14.35 ▼ 2.18% UGPA3 32.46 ▲ 1.15% VBBR3 35.05 ▲ 1.59% BBSE3 41.05 ▲ 1.26% BPAC11 56.18 ▲ 1.13% CURY3 30.23 ▼ 0.53% AERI3 2.08 ▲ 1.46% VIVARA 22.57 ▲ 2.54% COMPASS 25.20 ▼ 0.40% VAMOS 3.34 ▲ 5.36% SANB11 27.53 ▲ 0.62% ASAI3 8.27 ▲ 1.97% SBSP3 28.50 ▼ 1.28% WALMEX 49.05 ▲ 1.34% GMEXICO 209.48 ▼ 0.01% FEMSA 224.03 ▼ 3.02% CEMEX 21.00 ▼ 1.73% GFNORTE 200.29 ▲ 1.97% BIMBO 60.70 ▲ 2.69% TELEVISA 9.90 ▲ 0.20% AMX 22.53 ▲ 0.31% GAP 382.49 ▲ 1.83% ASUR 270.00 ▲ 0.53% OMA 236.06 ▲ 3.20% KOF 188.00 ▼ 0.89% GRUMA 269.24 ▲ 0.26% KIMBER 40.78 ▲ 2.21% SQM-B 61,656 ▼ 4.63% COPEC 6,266 ▲ 0.28% BSANTANDER 79.01 ▼ 2.18% FALABELLA 6,147 ▼ 0.14% ENELAM 85.73 ▼ 0.19% CENCOSUD 1,886 ▼ 1.51% CMPC 1,031 ▼ 0.84% BANCO CHILE 189.19 ▼ 2.11% LATAM AIR 24.76 ▲ 0.65% YPF 79,150 ▼ 2.55% GGAL 7,740 ▼ 2.76% PAMPA 5,370 ▼ 1.92% TXAR 666.50 ▼ 1.11% ALUAR 990.50 ▲ 0.61% TGS 9,475 ▼ 2.42% CEPU 2,325 ▼ 2.43% MIRGOR 16,600 ▼ 1.34% COME 42.50 ▲ 0.09% LOMA NEGRA 3,603 ▼ 2.83% BYMA 301.00 ▼ 0.58% TELECOM ARG 4,360 ▼ 2.90% ECOPETROL 15.75 ▼ 0.32% BANCOLOMBIA 89.50 ▲ 1.78% GRUPO AVAL 4.95 ▲ 2.70% CREDICORP 389.44 ▼ 0.40% SOUTHERN COPPER 178.62 ▼ 0.39% BUENAVENTURA 30.34 ▼ 4.35% MERCADOLIBRE 1,863 ▲ 2.37% NUBANK 14.68 ▲ 1.00% XP 16.89 ▲ 0.87% PAGSEGURO 9.51 ▲ 1.33% STONE 11.05 ▲ 1.42% GLOBANT 35.29 ▲ 8.12% TECNOGLASS 46.90 ▲ 3.35% GAP AIRPORT 219.47 ▲ 1.48% ASUR 270.00 ▲ 0.53% OMA AIRPORT 108.28 ▲ 3.32% AMX ADR 25.81 ▲ 0.43% FEMSA ADR 128.18 ▼ 3.01% CEMEX ADR 11.99 ▼ 1.72% PETROBRAS ADR 18.14 ▲ 0.75% VALE ADR 14.70 ▼ 0.58% ITAU ADR 8.34 ▼ 0.36% SANTANDER BR 5.50 ▲ 1.10% AMBEV ADR 3.12 ▲ 1.63% CSN 1.10 ▼ 2.23% GERDAU 4.93 ▲ 2.07% LATAM ADR 53.06 ▲ 1.43% BTC 63,707 ▼ 0.03% ETH 1,911 ▲ 1.09% SOL 73.86 ▼ 0.38% XRP 1.06 ▼ 0.71% BNB 569.28 ▲ 0.63% ADA 0.16 ▲ 1.98% DOGE 0.07 ▲ 0.51% AVAX 6.53 ▲ 2.09% LINK 8.33 ▼ 0.34% DOT 0.76 ▲ 0.22% LTC 46.25 ▲ 0.55% BCH 212.45 ▲ 0.34% TRX 0.32 ▼ 0.20% XLM 0.17 ▲ 0.36% HBAR 0.07 — 0.00% NEAR 1.64 ▼ 2.82% ATOM 1.29 ▼ 0.47% AAVE 101.04 ▲ 3.26% SELIC 14.25% EMBRAER 87.81 ▲ 1.05% EMBRAER ADR 68.66 ▲ 0.99% JBS 13.87 ▲ 2.32% JBS BDR 70.94 ▲ 2.47% MBRF3 16.60 ▲ 4.47% MBRFY 3.17 ▲ 10.84% INTER 5.59 ▲ 0.54% IBOV 176,670.20 ▲ 0.76% IPSA 10,838.27 ▼ 1.15% IPC MEX 67,183.26 ▲ 1.20% MERVAL 3,250,903 ▼ 1.65% COLCAP 2,291.28 ▲ 0.37% BVL PERÚ 57,237.60 — — USD/BRL 5.12 ▲ 0.04% USD/MXN 17.43 ▼ 0.13% USD/CLP 931.47 ▼ 0.89% USD/COP 3,202 ▼ 0.48% USD/PEN 3.40 ▼ 0.05% USD/ARS 1,500 ▲ 0.17% USD/UYU 40.20 ▲ 1.42% USD/PYG 6,020 ▲ 1.46% USD/BOB 11.30 ▲ 3.36% USD/DOP 57.82 ▲ 0.47% USD/CRC 449.99 ▲ 1.60% USD/GTQ 7.62 ▲ 2.22% USD/HNL 26.76 ▲ 1.54% USD/NIO 36.62 ▲ 0.69% USD/VES 740.95 ▼ 0.05% USD/PAB 1.00 — 0.00% USD/BZD 2.00 — 0.00% USD/JMD 157.19 ▲ 0.07% USD/TTD 6.75 ▲ 1.25% EUR/BRL 5.83 ▲ 0.76% BRENT 84.04 ▼ 4.89% WTI 79.20 ▼ 4.13% IRON ORE 161.91 — — COPPER 6.34 ▼ 0.06% GOLD 4,024 ▼ 1.24% SILVER 57.38 ▼ 1.87% SOY 1,220 ▲ 0.93% CORN 481.00 ▲ 6.47% WHEAT 664.75 ▲ 0.72% COFFEE 340.50 ▲ 4.91% SUGAR 14.56 ▼ 0.14% ORANGE JUICE 136.30 ▼ 3.64% COTTON 81.08 ▲ 2.19% COCOA 5,206 ▲ 2.08% BEEF 221.78 ▼ 1.53% CATTLE 336.85 ▼ 0.41% LITHIUM 66.93 ▼ 2.48% PETR4 41.17 ▲ 0.39% VALE3 75.47 ▼ 0.29% ITUB4 42.82 ▲ 0.30% BBDC4 18.78 ▲ 0.37% ABEV3 16.07 ▲ 1.32% BBAS3 20.74 ▲ 1.17% B3SA3 16.08 ▲ 2.29% WEGE3 46.56 ▲ 0.34% PRIO3 56.55 ▲ 1.51% SUZB3 42.89 ▲ 2.44% RENT3 38.23 ▲ 1.35% AZZA3 17.22 ▲ 0.64% CSAN3 3.99 ▲ 1.01% RAIZ4 0.26 — 0.00% PCAR3 2.78 ▲ 1.46% GMAT3 3.93 ▲ 2.61% PSSA3 54.91 ▲ 1.14% CVCB3 1.31 ▼ 3.68% POSI3 3.57 ▲ 1.42% SLCE3 13.21 ▼ 1.27% NATU3 8.44 ▼ 0.59% BRKM5 6.02 ▼ 0.99% RANI3 8.13 ▲ 2.52% CSNA3 5.59 ▼ 2.10% CMIN3 5.90 ▲ 1.72% USIM5 8.65 ▲ 0.46% GGBR4 25.14 ▲ 2.70% ENEV3 25.85 ▲ 1.49% CPFE3 45.78 ▲ 2.30% CMIG4 11.16 ▼ 0.09% EQTL3 38.97 ▲ 0.44% LREN3 13.92 ▲ 1.38% VIVT3 33.87 ▼ 6.20% RAIL3 14.04 ▲ 1.74% KLABIN 18.12 ▲ 2.49% RAIA DROGASIL 18.14 ▼ 0.17% RDOR3 34.41 ▲ 2.41% HAPV3 10.60 ▲ 4.02% FLRY3 16.98 ▲ 2.72% SMTO3 14.35 ▼ 2.18% UGPA3 32.46 ▲ 1.15% VBBR3 35.05 ▲ 1.59% BBSE3 41.05 ▲ 1.26% BPAC11 56.18 ▲ 1.13% CURY3 30.23 ▼ 0.53% AERI3 2.08 ▲ 1.46% VIVARA 22.57 ▲ 2.54% COMPASS 25.20 ▼ 0.40% VAMOS 3.34 ▲ 5.36% SANB11 27.53 ▲ 0.62% ASAI3 8.27 ▲ 1.97% SBSP3 28.50 ▼ 1.28% WALMEX 49.05 ▲ 1.34% GMEXICO 209.48 ▼ 0.01% FEMSA 224.03 ▼ 3.02% CEMEX 21.00 ▼ 1.73% GFNORTE 200.29 ▲ 1.97% BIMBO 60.70 ▲ 2.69% TELEVISA 9.90 ▲ 0.20% AMX 22.53 ▲ 0.31% GAP 382.49 ▲ 1.83% ASUR 270.00 ▲ 0.53% OMA 236.06 ▲ 3.20% KOF 188.00 ▼ 0.89% GRUMA 269.24 ▲ 0.26% KIMBER 40.78 ▲ 2.21% SQM-B 61,656 ▼ 4.63% COPEC 6,266 ▲ 0.28% BSANTANDER 79.01 ▼ 2.18% FALABELLA 6,147 ▼ 0.14% ENELAM 85.73 ▼ 0.19% CENCOSUD 1,886 ▼ 1.51% CMPC 1,031 ▼ 0.84% BANCO CHILE 189.19 ▼ 2.11% LATAM AIR 24.76 ▲ 0.65% YPF 79,150 ▼ 2.55% GGAL 7,740 ▼ 2.76% PAMPA 5,370 ▼ 1.92% TXAR 666.50 ▼ 1.11% ALUAR 990.50 ▲ 0.61% TGS 9,475 ▼ 2.42% CEPU 2,325 ▼ 2.43% MIRGOR 16,600 ▼ 1.34% COME 42.50 ▲ 0.09% LOMA NEGRA 3,603 ▼ 2.83% BYMA 301.00 ▼ 0.58% TELECOM ARG 4,360 ▼ 2.90% ECOPETROL 15.75 ▼ 0.32% BANCOLOMBIA 89.50 ▲ 1.78% GRUPO AVAL 4.95 ▲ 2.70% CREDICORP 389.44 ▼ 0.40% SOUTHERN COPPER 178.62 ▼ 0.39% BUENAVENTURA 30.34 ▼ 4.35% MERCADOLIBRE 1,863 ▲ 2.37% NUBANK 14.68 ▲ 1.00% XP 16.89 ▲ 0.87% PAGSEGURO 9.51 ▲ 1.33% STONE 11.05 ▲ 1.42% GLOBANT 35.29 ▲ 8.12% TECNOGLASS 46.90 ▲ 3.35% GAP AIRPORT 219.47 ▲ 1.48% ASUR 270.00 ▲ 0.53% OMA AIRPORT 108.28 ▲ 3.32% AMX ADR 25.81 ▲ 0.43% FEMSA ADR 128.18 ▼ 3.01% CEMEX ADR 11.99 ▼ 1.72% PETROBRAS ADR 18.14 ▲ 0.75% VALE ADR 14.70 ▼ 0.58% ITAU ADR 8.34 ▼ 0.36% SANTANDER BR 5.50 ▲ 1.10% AMBEV ADR 3.12 ▲ 1.63% CSN 1.10 ▼ 2.23% GERDAU 4.93 ▲ 2.07% LATAM ADR 53.06 ▲ 1.43% BTC 63,707 ▼ 0.03% ETH 1,911 ▲ 1.09% SOL 73.86 ▼ 0.38% XRP 1.06 ▼ 0.71% BNB 569.28 ▲ 0.63% ADA 0.16 ▲ 1.98% DOGE 0.07 ▲ 0.51% AVAX 6.53 ▲ 2.09% LINK 8.33 ▼ 0.34% DOT 0.76 ▲ 0.22% LTC 46.25 ▲ 0.55% BCH 212.45 ▲ 0.34% TRX 0.32 ▼ 0.20% XLM 0.17 ▲ 0.36% HBAR 0.07 — 0.00% NEAR 1.64 ▼ 2.82% ATOM 1.29 ▼ 0.47% AAVE 101.04 ▲ 3.26% SELIC 14.25% EMBRAER 87.81 ▲ 1.05% EMBRAER ADR 68.66 ▲ 0.99% JBS 13.87 ▲ 2.32% JBS BDR 70.94 ▲ 2.47% MBRF3 16.60 ▲ 4.47% MBRFY 3.17 ▲ 10.84% INTER 5.59 ▲ 0.54%
since 2009
Tuesday, July 28, 2026

Brazil Business

Vivo Brazil Profit Hits US$308M on Mobile, Fiber Growth

By · July 28, 2026 · 5 min read

Daily Brief

The morning intel from across Latin America. Free.

By subscribing you agree to our privacy policy. We never share your email.

Brazil · Business

Vivo Brazil earnings for the second quarter of 2026 showed a 17.0% jump in net profit, as Telefônica Brasil (B3: VIVT3), the country’s largest telecom operator, reported net income of R$1.57 billion (~US$308 million). The result, released on July 27, was in line with market expectations and marked the strongest EBITDA growth since the third quarter of 2023.

Key Facts

Net Profit. R$1.57 billion (~US$308 million), up 17.0% year-on-year in Q2 2026.

Operating Revenue. R$15.76 billion (~US$3.09 billion), a 7.6% increase from the prior year.

EBITDA. R$6.58 billion (~US$1.29 billion), rising 10.9% YoY with a 41.8% margin.

Growth Drivers. Mobile postpaid services, FTTH (fiber-to-the-home), and digital services.

Electronics Push. Appliance and electronics revenue jumped 27.8% to R$1.048 billion (~US$205 million), advancing Vivo’s move into consumer-electronics retail.
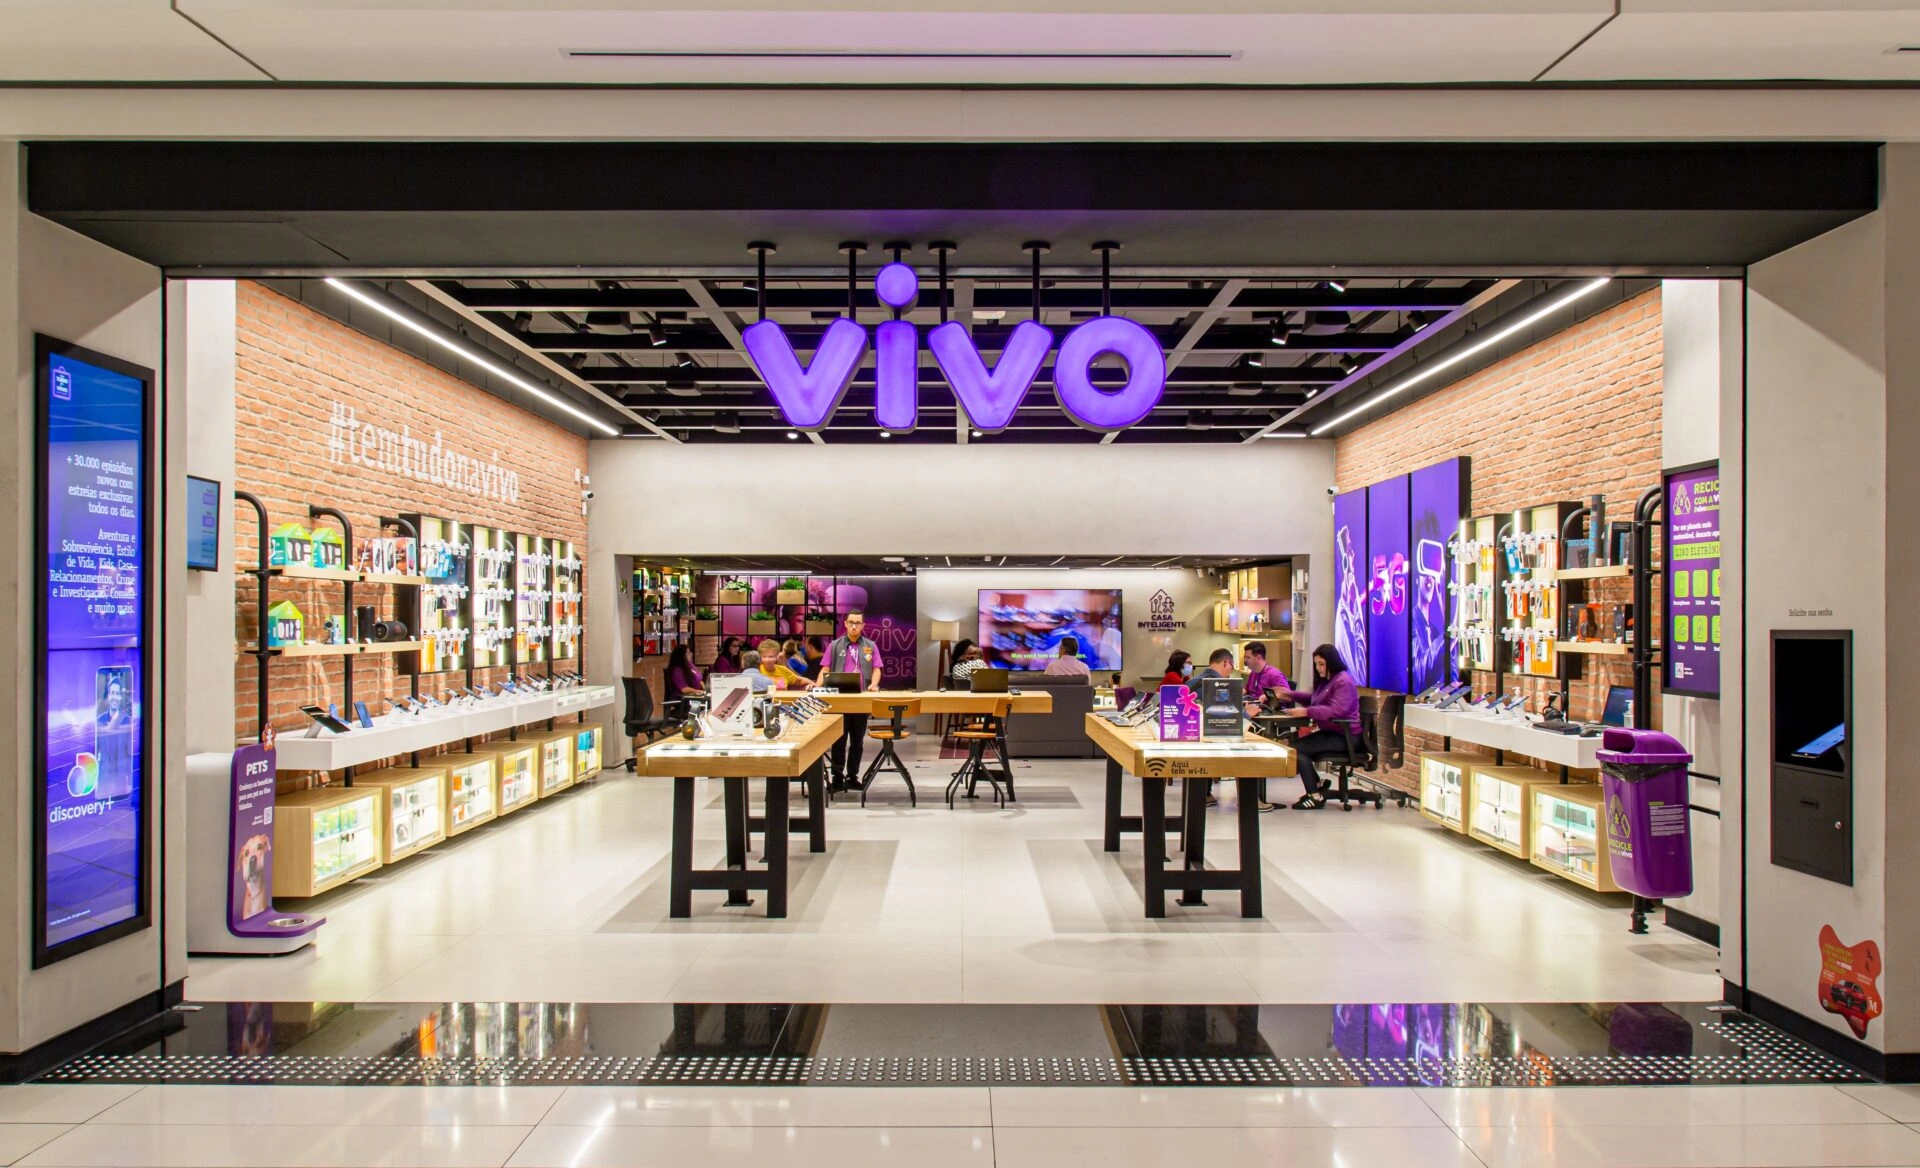
Vivo Brazil Earnings Jump 17% on Mobile, Fiber Growth. (Photo internet reproduction)
RT
Ask Rio Times
Latin American markets, currencies and companies.
Open the full Ask Rio Times →

Revenue and Profitability Drivers

Net operating revenue for Brazil‘s top carrier climbed 7.6% year-on-year to R$15.76 billion (~US$3.09 billion). The expansion was primarily fueled by its mobile postpaid segment, fiber-to-the-home (FTTH) broadband service, and a growing portfolio of digital services.

Earnings before interest, taxes, depreciation, and amortization (EBITDA) reached R$6.58 billion (~US$1.29 billion). This 10.9% increase from the R$5.93 billion (~US$1.16 billion) recorded a year earlier pushed the EBITDA margin to a robust 41.8%.

For readers unfamiliar with the term, EBITDA is a widely used measure of a company’s core operating profitability. It strips out costs that can vary significantly depending on a firm’s debt structure, tax situation, and accounting choices around large asset purchases. A rising EBITDA margin, such as the one Vivo just posted, often signals that a business is gaining operating leverage — meaning each additional real of revenue is generating proportionally more profit. In Brazil’s high-volume, infrastructure-heavy telecom sector, this metric is closely watched because building and maintaining networks requires enormous upfront capital, and investors want to see those investments translate into efficient, recurring cash generation.

The Push into Consumer Electronics Retail

Beyond connectivity, Vivo is expanding into consumer-electronics retail – and it is already showing up in the numbers. Revenue from appliances and electronics jumped 27.8% year over year to R$1.048 billion (~US$205 million) in the quarter.

By selling devices through its large store network and digital channels, the carrier competes more directly with traditional retailers and captures higher-margin hardware sales alongside recurring service fees – a diversification foreign investors are watching closely.

This strategy mirrors a broader global trend among telecom operators seeking to become more than simple connectivity providers. By controlling the point of sale for smartphones, laptops, and smart-home devices, a carrier can bundle hardware with long-term service contracts, potentially reducing customer churn. In Brazil, where a significant portion of the population still buys electronics through installment plans, a trusted carrier with an existing billing relationship can position itself as a natural financing partner. The open question is whether Vivo can scale this retail push without the inventory risk and thin margins that typically challenge dedicated electronics chains.

Live Company IntelligenceTelefônica Brasil S.A. — the full investor dossierInside: live share price, market cap, three-year financials, valuation, ESG and peer benchmarks — plus the latest Rio Times coverage.
T
◆ Live Company Intelligence
Telefônica Brasil
SA: VIVT3VIVT3Communication ServicesTelecom Services35,010 employees
R$115.39B
Market cap

Valuation & profitability

Market capR$115.39B
Revenue (TTM)R$60.66B
P / E ratio18.3
Profit margin10.5%
Return on equity9.3%

Price & risk

52-wk low
$28.54
52-wk high
$41.36
Beta (volatility)0.22
200-day average$36.40

Revenue trend · 6y

20202025
Latest R$59.60B

Ownership

Institutions9.3%
Shares outstanding3.20B

Dividend

Yield2.1%
Payout ratio67.3%
Fwd. annual$2.48
What Telefônica Brasil does. Telefônica Brasil S.A., together with its subsidiaries, operates as a mobile telecommunications company in Brazil. Its fixed line voice services portfolio includes local, domestic long-distance, and international long-distance calls; and mobile portfolio comprises voice and broadband internet access through 3G, 4G, 4.5G, and 5G, as well as value-added, prepaid plans with data…
Data: EODHD fundamentals (VIVT3.SA) · figures in BRL · as of 28 Jul 2026More company intelligence →

Market Position: Vivo vs. TIM and Claro

Vivo operates as the market leader in Brazil’s competitive telecom sector, which is dominated by three major players. Its main rivals are TIM Brasil and Claro, the local subsidiary of Mexican telecom group América Móvil.

The company’s scale in mobile postpaid and fiber broadband provides a defensive moat. While all three carriers compete aggressively on 5G expansion, Vivo’s latest results underscore its ability to grow profitability while maintaining its number-one market share.

For context, Brazil’s telecom market is structured around a national regulatory framework overseen by Anatel, the country’s telecommunications agency. The three-way rivalry among Vivo, TIM, and Claro has shaped pricing and investment cycles for years. Postpaid mobile customers — those who pay a monthly bill rather than topping up prepaid credit — are particularly valuable because they generate more predictable revenue and tend to consume more data. Fiber-to-the-home broadband, meanwhile, has become a key battleground as millions of Brazilian households upgrade from older copper-based connections. Vivo’s ability to lead in both categories simultaneously is a central reason its financial results have drawn consistent attention from analysts covering Latin American equities.

Shareholder Returns and Capital Allocation

Telefônica Brasil has a well-established policy of distributing earnings to shareholders through dividends and interest on equity (JCP). The company continued this practice in the second quarter, though the exact per-share payout amount for the period was not specified in the initial earnings summary.

For expats and foreign investors holding VIVT3 shares on the B3 exchange, these regular distributions form a key part of the stock’s total return profile. The company’s free cash flow generation supports these payouts, even as it invests in network expansion.

Interest on equity, or JCP, is a Brazil-specific mechanism that allows companies to treat a portion of shareholder distributions as a tax-deductible expense, making it a tax-efficient way to return capital. For international investors, understanding the interplay between dividends and JCP is important because the tax treatment can differ depending on one’s country of residence and whether a double-taxation treaty applies. What remains to be seen is how Vivo will balance its capital allocation priorities going forward — specifically, whether the accelerating push into electronics retail will require heavier inventory investment that could temporarily pressure the free cash flow available for shareholder returns.

What It Means for Foreign Investors

For international readers, the results demonstrate the resilience of Brazil’s large consumer market. A net profit of ~US$308 million in a single quarter reflects the scale opportunity in Latin America’s biggest economy, where demand for premium data services continues to rise.

The US dollar figures, converted at a rate of 5.1 reais, offer a clear lens for portfolio evaluation. Vivo’s push into device retail adds a new growth vector, though execution risk remains a factor to monitor in future earnings calls.

Currency volatility is a permanent consideration when evaluating Brazilian equities. The real has historically swung widely against the dollar, meaning that even strong local-currency results can translate into uneven returns for foreign portfolios. Beyond the exchange rate, investors will likely be watching two broader themes. First, whether Brazil’s macroeconomic environment — including the trajectory of interest rates set by the central bank — supports continued consumer spending on telecom and electronics. Second, how the competitive dynamics with TIM and Claro evolve as all three players deepen their fiber and 5G footprints. These factors will help determine whether Vivo’s current margin strength proves durable or faces compression in the quarters ahead.

Frequently Asked Questions

What drove the 17% increase in Vivo Brazil earnings for Q2 2026?
The profit jump was driven by a 7.6% rise in net operating revenue, fueled by growth in mobile postpaid subscriptions, fiber broadband (FTTH), and digital services. EBITDA grew 10.9%, marking the strongest increase since Q3 2023.
How much is Vivo’s net profit in US dollars?
Vivo’s Q2 2026 net profit of R$1.57 billion converts to approximately US$308 million, based on an exchange rate of 5.1 Brazilian reais per US dollar.
What is Vivo’s consumer electronics retail strategy?
Vivo’s appliance and electronics revenue grew 27.8% to R$1.048 billion (~US$205 million) in Q2 2026. The carrier is using its store network and digital channels to expand into consumer-electronics retail.
Display draft for copy-paste review only — NOT published. Cover image viewed and cleared as brand-safe.

LatAm Markets: Live Signals → — real-time movers, turnover leaders and FX across Latin America.

Read More from The Rio Times

The Rio Times · Power Map
See who really holds power in Latin America
Click to open the Power Map

Rotate for Best Experience

This report is optimized for landscape viewing. Rotate your phone for the full experience.