Corn Sinks to a Three-Month Low as Harvest and Real Weigh

Key Facts
- The corn tracker closed at US$17.34, -0.57%, its lowest close in at least three months and 14.5% below its 1 September high.
- The soybean tracker rose 0.11% to US$26.14 and the wheat tracker rose 0.14% to US$22.20, small gains in a falling market.
- November soybean futures lost 34.25 cents on the week and 70.75 cents on the month, settling at US$12.22 a bushel as funds kept selling despite strong Chinese buying.
- December corn futures fell 8.25 cents on the week to about 447 cents a bushel, after a fifth weekly fall in a row for the corn fund.
- The Brazilian real weakened 1.1% to R$5.44 per dollar after the Thursday close, making Brazilian grain cheaper for foreign buyers.
- Corn export sales are 34% below last year, at 28% of the USDA forecast against 38% normally at this point in the season.
Today’s Focus
Corn fell to its lowest close in at least three months on Friday, 30 October 2026, because supply is large and the people who bet on higher prices are leaving. The CORN fund fell 0.57% to US$17.34, and December corn futures lost about 8 cents on the week to roughly 447 cents a bushel.
Soybeans and wheat held up better, with the trackers up 0.11% and +0.14%, but both sit well below their summer highs. The wheat fund is 20.7% under its 28 August peak and the soybean fund is 7.1% under its 10 September peak.
Three forces work against prices at once: a harvest that is moving along in good weather, hedge funds cutting long positions, and a Brazilian real that fell to about R$5.44 per dollar and lets Brazilian farmers sell cheaper. China is buying US soybeans in size, yet that has not been enough to stop the slide.
For US farmers this means lower revenue per acre going into winter. For Brazil’s soybean and corn growers a weak real cushions the pain in local money, while Argentina’s wheat farmers face a short crop but low world prices.
What matters today. Grain prices are being set by supply and by money leaving the market, and only a rebound in exports or a stronger real would change that.
01 The session in one read
Chicago grains ended the week with corn weaker, soybeans and wheat barely higher, and a clear sense that rallies are being sold. The corn tracker settled at US$17.34, -0.57%, a three-month low for the fund.
November soybeans finished at US$12.22 a bushel, up 2.5 cents, in a mixed session. December Chicago wheat held at about 603 cents, close to unchanged.
The best-supported ranking is, first, ample supply from the US harvest and big South American plantings; second, fund liquidation, with managed money (hedge funds and other large speculators) in corn net long about 147,000 contracts in the week to 20 October and a trade estimate near 100,000 a week later; and third, the weaker real, which hands Brazil a price edge. Confidence is high on the first two, medium on the real, whose effect is real but smaller.
The variable to watch is Chinese buying of US cargoes against the pace of Brazil’s new-crop soybean planting, because a sustained rise in US export sales is the one thing that can turn this market.
02 The board
The soybean tracker closed at US$26.14, +0.11%, and the wheat tracker at US$22.20, +0.14%. These are exchange-traded funds that follow the futures, so their moves are smaller than the futures swings.
On the week, November soybean futures lost 34.25 cents and December soybean meal lost US$21.50 a ton. Soybean oil has been driven by US biofuel policy more than by crude since August, even though US benchmark crude rose more than 2% on Friday.
| Asset | Level | Change |
|---|---|---|
| Soybeans (SOYB) | US$26.14 | +0.11% |
| Corn (CORN) | US$17.34 | -0.57% |
| Wheat (WEAT) | US$22.20 | +0.14% |
Source: RT close, 2026-10-30. Where a commodity has no spot feed, an exchange-traded tracker or leading producer is shown as a labelled proxy.
Live Market IntelligenceThe live market board
Rio Times · Live Market Intelligence
Latin America — Cross-Market Board
| Instrument | Last | Change | YoY | Prev. | High | Low | Volume |
|---|---|---|---|---|---|---|---|
| IBOV | 167,921.80 | -0.75% | +19.56% | 169,186.42 | 178,526 | 175,157 | — |
| IPSA | 10,253.96 | -2.76% | — | 10,545.26 | 10,722 | 10,633 | — |
| IPC MEX | 69,705.03 | -0.12% | +12.74% | 69,787.41 | 70,008 | 69,383 | 49,372,306 |
| MERVAL | 92,079 | -2.59% | +12.65% | 2,859,051 | — | — | — |
| COLCAP | 2,490.92 | +0.04% | — | — | — | — | — |
| USD/BRL | 5.34 | -1.32% | -0.84% | 5.42 | 5.42 | 5.30 | — |
| EUR/BRL | 5.95 | +7.53% | -4.87% | 5.54 | 6.04 | 5.92 | — |
| USD/MXN | 18.69 | +0.62% | +1.45% | 18.57 | 18.69 | 18.54 | — |
| USD/CLP | 983.47 | -0.57% | +5.64% | 989.13 | 991.87 | 979.07 | — |
| USD/COP | 3,149 | +3.06% | -18.02% | 3,056 | 3,173 | 3,111 | — |
| USD/PEN | 3.45 | +0.17% | +3.85% | 3.44 | 3.45 | 3.44 | — |
| USD/ARS | 1,537 | -0.28% | +3.77% | 1,541 | 1,541 | 1,537 | — |
| USD/UYU | 40.21 | +3.57% | +2.29% | 38.83 | 40.21 | 40.08 | — |
| USD/PYG | 5,803 | +3.78% | -16.54% | 5,592 | 5,803 | 5,735 | — |
| USD/BOB | 11.97 | +4.93% | +77.92% | 11.41 | 11.97 | 11.82 | — |
| USD/DOP | 60.54 | +1.83% | -4.34% | 59.45 | 61.14 | 59.85 | — |
| USD/CRC | 451.24 | +2.13% | -7.80% | 441.83 | 451.40 | 450.04 | — |
| USD/GTQ | 7.64 | +3.23% | +2.18% | 7.40 | 7.64 | 7.64 | — |
03 Why it moved: a heavy harvest, fund selling and a weaker real
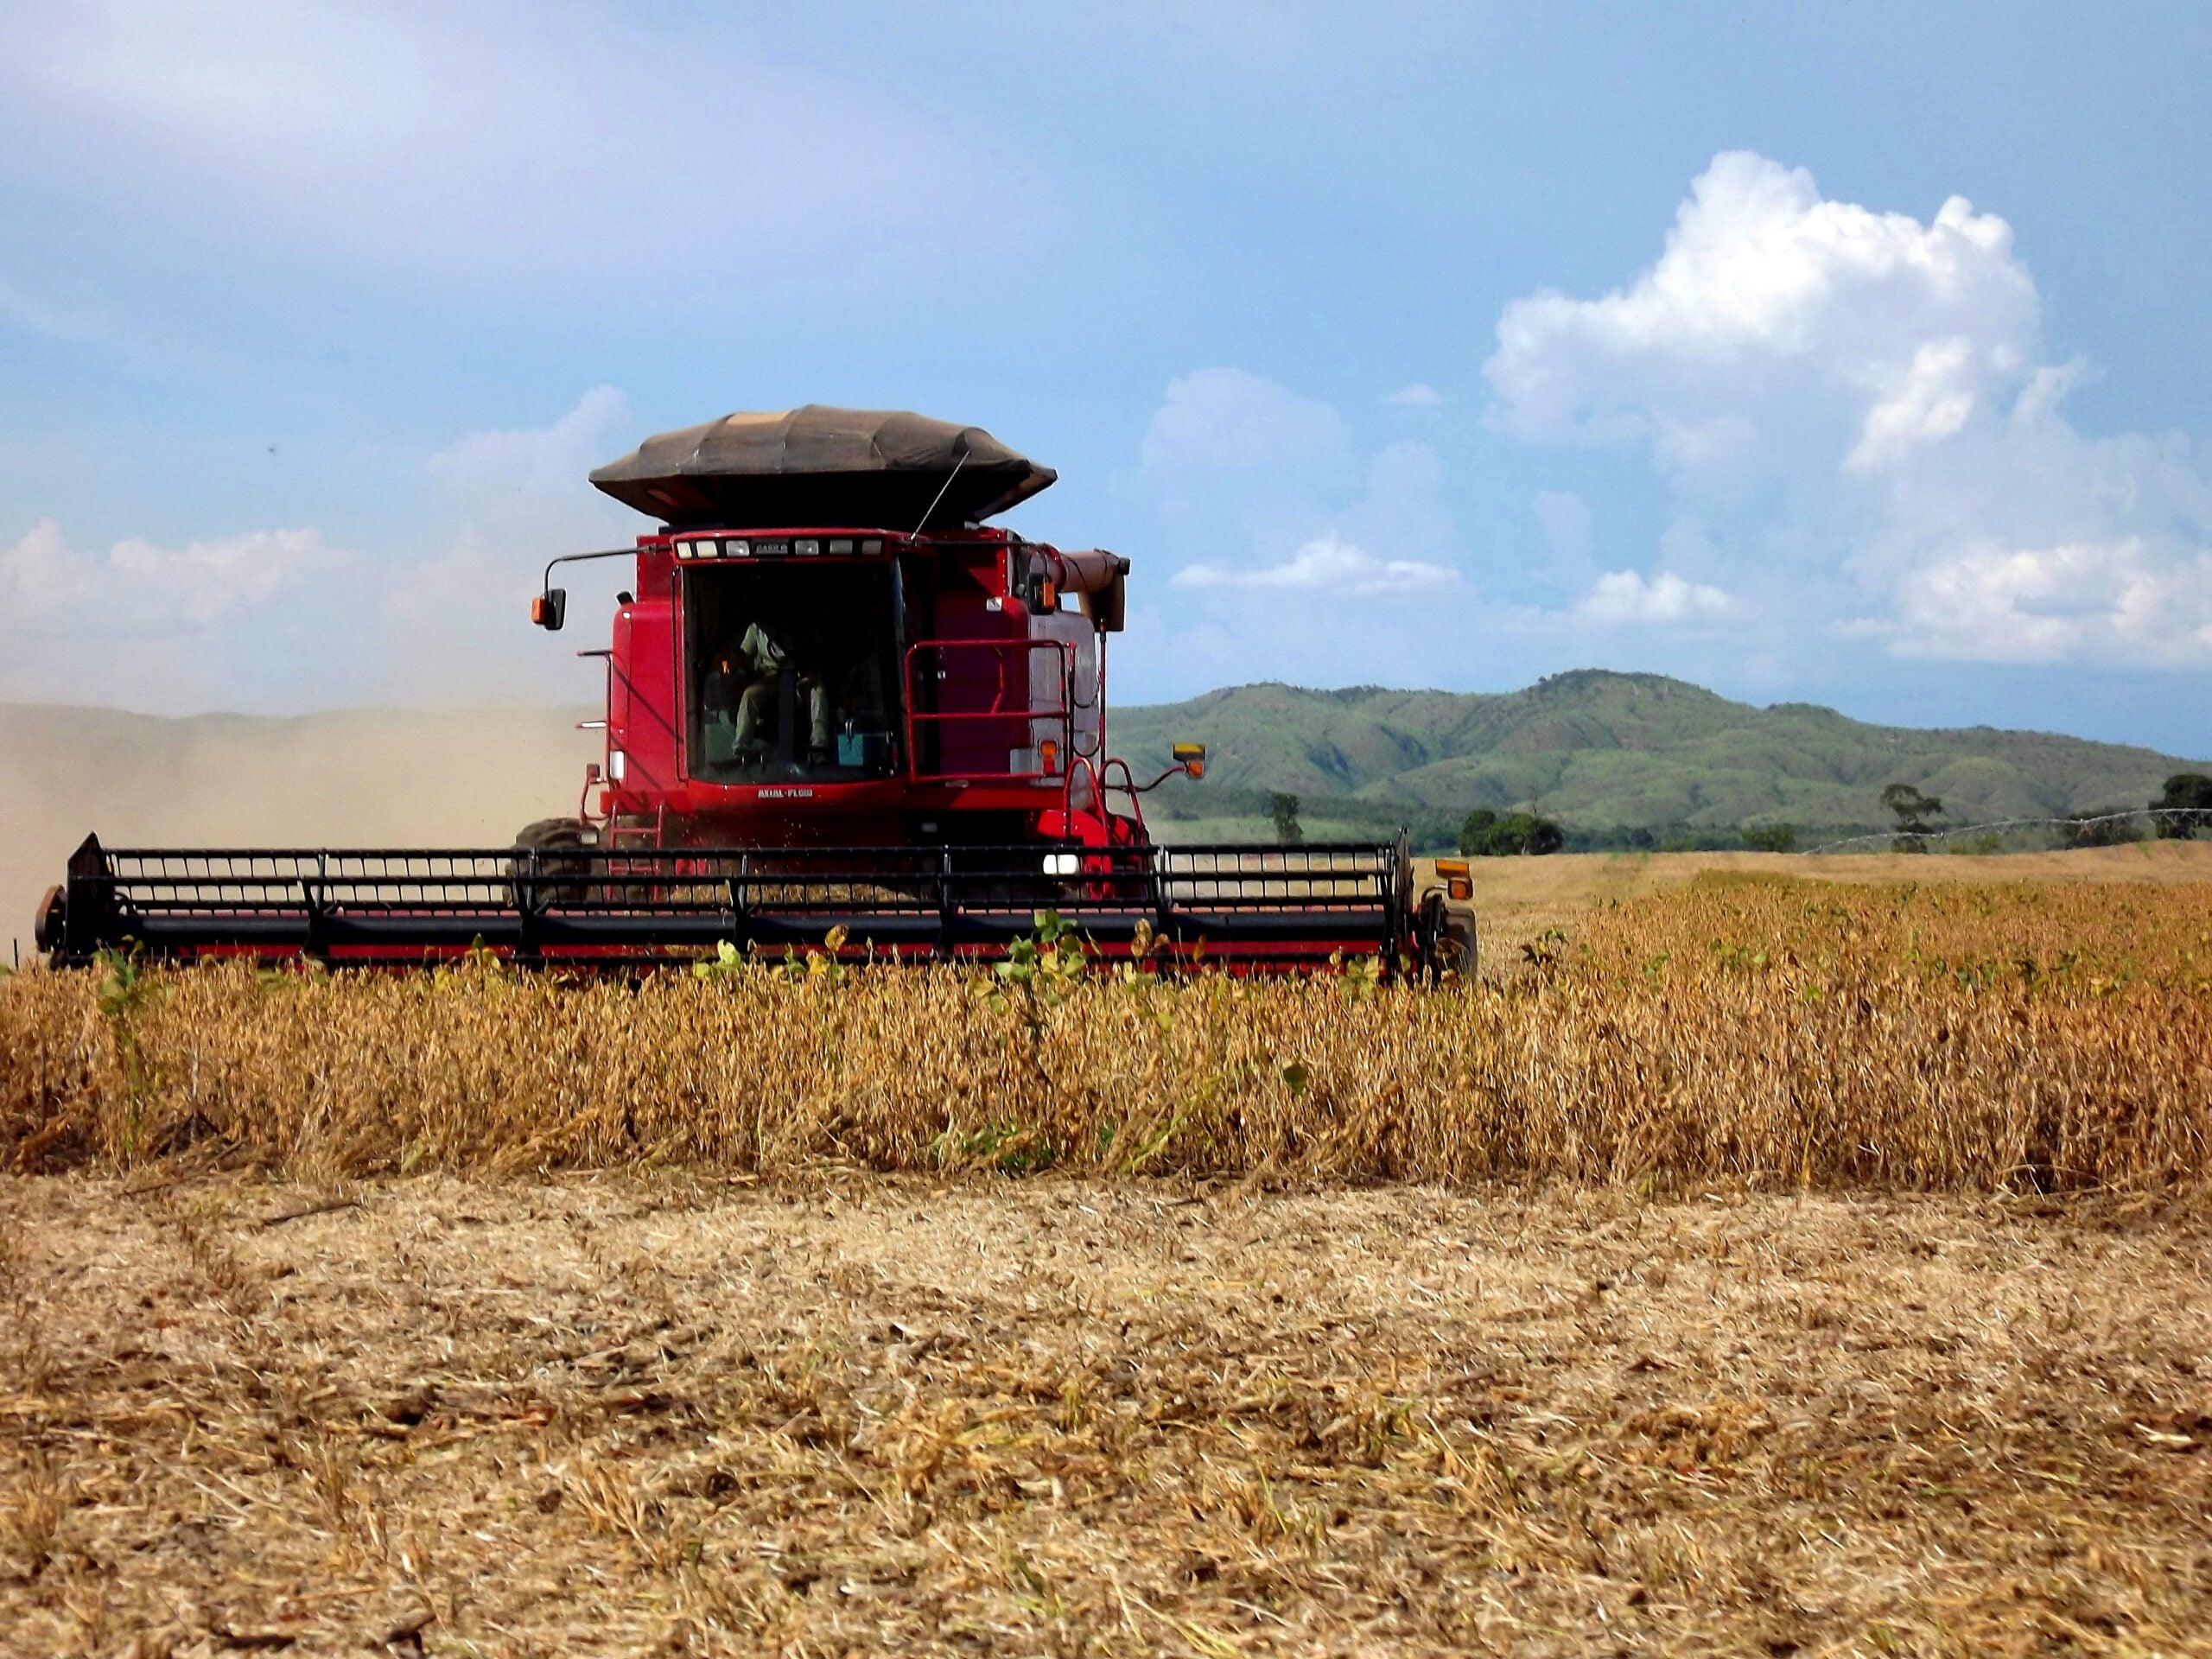
The first cause is supply. About 79% of the US soybean crop was harvested as of last week, and corn is 60% done, behind the five-year average of 66%, and expectations of a comfortable corn supply have capped every rally.
The second cause is money leaving. Funds kept selling, and managed money in corn cut its net long to about 147,000 contracts in the week to 20 October, with a trade estimate of nearer 100,000 for the following week.
The third cause is currency and politics in Brazil. After Luiz Inacio Lula da Silva won the 25 October runoff, the real has weakened, ending at about R$5.44 per dollar against R$5.38 on Thursday, and a weaker real makes Brazilian soybeans and corn cheaper in dollars for buyers such as China.
Against this, demand is not absent, and the US Department of Agriculture confirmed Chinese purchases of 612,000 tonnes of US soybeans for the 2026/27 season on 20 October, and private exporters reported two more sales of 165,150 and 132,000 tonnes to unknown buyers, yet fund selling outweighed them. Our confidence in this ranking is high.
04 The trend behind it
This is a continuation of a slow slide, not a panic. The corn fund is down 8.01% over 20 sessions and down 1.92% over five, and it is only 5.3% above its 29 June low of 16.47.
RT’s own price history offers a base rate. In the 41 earlier cases since 2010 when the corn fund fell 8.0% or more in 20 sessions, it was higher 20 sessions later in 22 of 41 cases (54%), with a median gain of 0.4% and a worst case of a 12.5% further fall; history is not a forecast.
Wheat is weaker still, down 10.30% over 20 sessions. In 28 earlier cases since 2011 with a fall that large, the wheat fund was higher 20 sessions later in only 11 of 28 cases (39%), with a median change of minus 0.8%, so a bounce has been the exception.
05 What it means for Latin America and the US
For Brazil, a weak real is a double-edged gift: it lifts reais earned per bag, but it also tells traders that Brazilian supply will come cheap, and that pushes world prices down.
For Argentina, the Buenos Aires Grain Exchange kept its 2026/27 wheat estimate at 23.4 million tonnes, 4.4 million below last year, but a smaller crop is not lifting world prices when Chicago is falling.
For US readers, cheaper grain is slow to reach shops, but it helps livestock feeders and hurts farm incomes, since corn export sales are 925 million bushels, 34% below last year and only 28% of the USDA forecast against 38% normally.
06 The names to watch
China’s state buyers are the most important name, because their purchases of US soybeans for shipment into 2027 are the main source of support. Flash sales are reported commitments, not shipments, and they can be cancelled.
The US Department of Agriculture is the second, through its weekly export sales and crop progress reports. On the Brazilian side, watch the real and the new-crop planting pace.
07 What would end it
A sustained move by the real back below R$5.30 per dollar would remove Brazil’s price edge, and a run of strong US export sales, especially to China, would show demand is back. On the chart, the soybean fund has support at its 13 January low of 21.71 and resistance at its 10 September high of 28.14.
The next tests are the US midterms on 3 November and the next weekly USDA export report. Corn’s nearest floor is the 29 June low of 16.47, only 5.3% below Friday’s close.
The honest answer is that this slide ends when funds finish selling or exports jump, and neither is visible yet. A close above 18 on the corn fund would be the first sign the three-month low is behind us.
08 What to watch
- US midterms, 3 November: Event risk around the vote may add to volatility; the fund-selling trend is the thing to watch afterwards.
- Weekly USDA export sales: Strong sales to China would challenge the supply story; weak ones would confirm it.
- Brazilian real: A move back below R$5.30 per dollar would remove Brazil’s currency edge; a move above R$5.50 would add to the pressure.
- Fund positions in corn: The weekly Commitment of Traders report, the US regulator’s count of fund positions, will show whether long liquidation from about 147,000 contracts is finished.
Frequently Asked Questions
Why did corn fall to a three-month low?
A large harvest in dry weather and sales by hedge funds outweighed demand. The corn fund closed down 0.57% at US$17.34.
Why does the Brazilian real matter for grain prices?
A weaker real makes Brazilian soybeans and corn cheaper in dollars for buyers like China. That pulls export demand away from US cargoes and presses futures lower.
Is China still buying US soybeans?
Yes, the US Department of Agriculture confirmed 612,000 tonnes on 20 October. Flash sales can be cancelled, and fund selling has outweighed the buying.
What would turn grain prices higher?
A run of strong US export sales or a stronger Brazilian real would help. So would fund selling running out after corn longs fell from about 147,000 contracts.
Market data: The Rio Times
This article was produced by The Rio Times’ automated newsroom system. How we use AI · Report an error · Editorial responsibility: Matthias Camenzind, Editor-in-Chief
LatAm Markets: Live Signals → — real-time movers, turnover leaders and FX across Latin America.