IBOV 185,147.15 ▼ 0.02% IPSA 11,315.26 ▼ 1.14% IPC MEX 64,639.55 ▼ 0.35% MERVAL 3,041,993 ▼ 0.23% COLCAP 2,556.17 ▲ 0.46% BVL PERÚ 59,789.81 ▼ 0.24% USD/BRL5.13▼ 0.01% USD/MXN16.93▲ 0.30% USD/CLP933.33▼ 0.13% USD/COP3,122▼ 0.26% USD/PEN3.36▲ 0.10% USD/ARS1,510▲ 0.08% USD/UYU40.24— 0.00% USD/PYG5,947— 0.00% USD/BOB12.40— 0.00% USD/DOP59.00— 0.00% USD/CRC448.67— 0.00% USD/GTQ7.63— 0.00% USD/HNL26.84— 0.00% USD/NIO36.62— 0.00% USD/VES811.71▲ 0.66% USD/PAB1.00— 0.00% USD/BZD2.00— 0.00% USD/JMD 157.28 — 0.00% USD/TTD6.71— 0.00% EUR/BRL5.96▲ 0.24% BRENT 88.88 ▼ 0.03% WTI 83.11 ▼ 0.11% IRON ORE 161.91 — — COPPER 6.61 ▲ 0.03% GOLD 4,461 ▲ 1.78% SILVER 65.59 ▲ 1.26% SOY 1,184 ▲ 3.20% CORN 480.50 ▲ 10.02% WHEAT 655.00 ▲ 3.93% COFFEE 317.25 ▼ 5.51% SUGAR 16.43 ▼ 1.79% ORANGE JUICE 138.55 ▼ 0.47% COTTON 85.03 ▲ 2.33% COCOA 5,719 ▲ 3.18% BEEF 223.60 ▼ 3.93% CATTLE 339.10 ▼ 3.16% LITHIUM 75.20 ▲ 1.47% PETR4 41.64 ▼ 0.05% VALE3 72.97 ▲ 0.83% ITUB4 38.60 ▼ 1.03% BBDC4 16.85 ▲ 0.36% ABEV3 14.89 ▼ 0.80% BBAS3 19.37 ▲ 0.47% B3SA3 14.26 ▼ 0.21% WEGE3 47.59 ▲ 0.49% PRIO3 59.14 ▼ 0.19% SUZB3 41.33 ▲ 2.35% RENT3 34.68 ▼ 0.09% AZZA3 15.89 ▼ 2.63% CSAN3 3.22 ▼ 1.83% RAIZ4 0.25 — 0.00% PCAR3 2.75 ▼ 0.36% GMAT3 3.65 ▼ 1.08% PSSA3 48.13 ▼ 0.54% CVCB3 1.33 ▼ 2.92% POSI3 3.36 ▲ 2.44% SLCE3 13.34 ▲ 0.30% NATU3 8.14 ▼ 0.73% IBOV 185,147.15 ▼ 0.02% IPSA 11,315.26 ▼ 1.14% IPC MEX 64,639.55 ▼ 0.35% MERVAL 3,041,993 ▼ 0.23% COLCAP 2,556.17 ▲ 0.46% BVL PERÚ 59,789.81 ▼ 0.24% USD/BRL 5.16 ▲ 0.01% USD/MXN 17.06 ▼ 0.24% USD/CLP 913.98 ▲ 0.04% USD/COP 3,140 ▲ 0.03% USD/PEN 3.36 ▼ 0.66% USD/ARS 1,493 ▲ 0.10% USD/UYU 40.27 ▲ 1.24% USD/PYG 5,939 ▲ 1.68% USD/BOB 11.64 ▼ 0.76% USD/DOP 58.34 ▲ 1.25% USD/CRC 445.92 ▲ 0.89% USD/GTQ 7.62 ▲ 2.21% USD/HNL 26.79 ▲ 1.57% USD/NIO 36.62 ▲ 0.69% USD/VES 762.44 ▼ 0.13% USD/PAB 1.00 — 0.00% USD/BZD 2.00 — 0.00% USD/JMD 157.28 — 0.00% USD/TTD 6.70 ▲ 0.61% EUR/BRL 5.95 ▲ 1.01% BRENT 88.88 ▼ 0.03% WTI 83.11 ▼ 0.11% IRON ORE 161.91 — — COPPER 6.61 ▲ 0.03% GOLD 4,461 ▲ 1.78% SILVER 65.59 ▲ 1.26% SOY 1,184 ▲ 3.20% CORN 480.50 ▲ 10.02% WHEAT 655.00 ▲ 3.93% COFFEE 317.25 ▼ 5.51% SUGAR 16.43 ▼ 1.79% ORANGE JUICE 138.55 ▼ 0.47% COTTON 85.03 ▲ 2.33% COCOA 5,719 ▲ 3.18% BEEF 223.60 ▼ 3.93% CATTLE 339.10 ▼ 3.16% LITHIUM 75.20 ▲ 1.47% PETR4 41.64 ▼ 0.05% VALE3 72.97 ▲ 0.83% ITUB4 38.60 ▼ 1.03% BBDC4 16.85 ▲ 0.36% ABEV3 14.89 ▼ 0.80% BBAS3 19.37 ▲ 0.47% B3SA3 14.26 ▼ 0.21% WEGE3 47.59 ▲ 0.49% PRIO3 59.14 ▼ 0.19% SUZB3 41.33 ▲ 2.35% RENT3 34.68 ▼ 0.09% AZZA3 15.89 ▼ 2.63% CSAN3 3.22 ▼ 1.83% RAIZ4 0.25 — 0.00% PCAR3 2.75 ▼ 0.36% GMAT3 3.65 ▼ 1.08% PSSA3 48.13 ▼ 0.54% CVCB3 1.33 ▼ 2.92% POSI3 3.36 ▲ 2.44% SLCE3 13.34 ▲ 0.30% NATU3 8.14 ▼ 0.73%
since 2009
Monday, September 7, 2026

Brazil Business - Brazil

Brazil’s Manufacturing Sector Hits a Decade High in Capacity Use

By · August 21, 2024 · 2 min read

Daily Brief

The morning intel from across Latin America. Free.

By subscribing you agree to our privacy policy. We never share your email.

In a notable development for Brazil’s manufacturing sector, July saw the highest utilization of production capacity in over ten years, alongside record-low inventory levels, according to a study by the Getulio Vargas Foundation (FGV).

The capacity utilization level (Nuci) reached 83.40%, a figure last seen in May 2011. Simultaneously, inventory levels dropped to 96.2 points, the lowest since March 2022.

These figures come amidst a backdrop of surging industrial demand. Low inventory levels typically signal a need to boost production to restock shelves—a straightforward economic response to avoid stockouts.

The latest data echoes a broader trend captured by the Brazilian Institute of Geography and Statistics (IBGE).

It reported a significant 4.1% month-on-month increase in industrial production in June, marking the sector’s strongest performance since the 2020 peak.
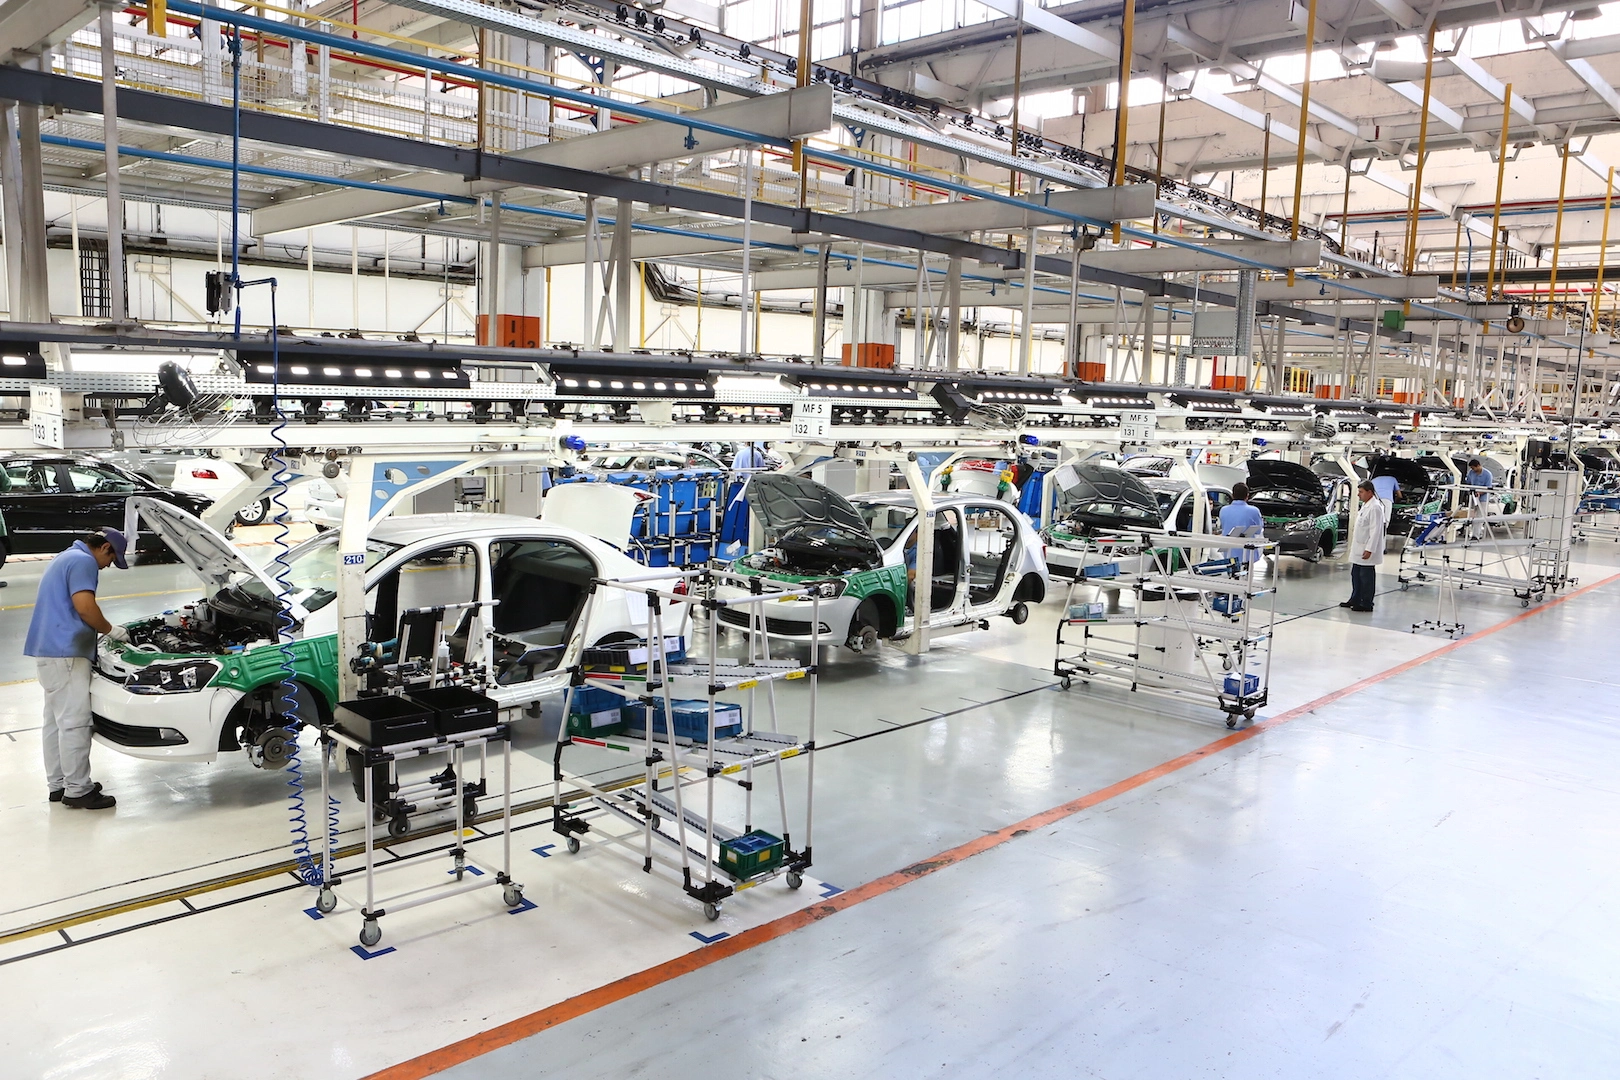
Brazil's Manufacturing Sector Hits a Decade High in Capacity Use
Brazil’s Manufacturing Sector Hits a Decade High in Capacity Use.
One-stop reference
Company Intelligence
Every listed company in Latin America — financials, ownership and structure for 1,450+ companies across 26 exchanges, in one place.
Browse the directory →
RT
Ask Rio Times
Latin American markets, currencies and companies.
Open the full Ask Rio Times →

Despite the positive momentum, challenges linger. The industry still operates 14.3% below its May 2011 peak performance levels.

The disparity stems from different economic contexts and industrial strategies, including investment levels and tax benefits that were more favorable a decade ago.

Brazil’s Manufacturing Sector

Economist Stefano Pacini from FGV points out that this revitalization is not due to a lack of production inputs, which had previously plagued the industry during global supply disruptions in 2021 and 2022.

Instead, the current low stock levels are driven by robust demand, cutting across various industry segments.

Furthermore, the industry’s outlook is cautiously optimistic. Analysts project continued growth, with factors like improved macroeconomic conditions—better income, employment rates, and sector confidence—boosting demand.

Yet, structural challenges remain, such as currency fluctuations impacting costs and inflation, which could temper the pace of recovery.

In summary, Brazil’s manufacturing sector is experiencing a significant upswing, driven by strong demand and efficient capacity utilization.

While the path ahead shows promise, navigating ongoing economic challenges will be crucial for sustaining this growth trajectory.

This article was produced by The Rio Times’ automated newsroom system. How we use AI · Report an error

Read More from The Rio Times

The Rio Times · Power Map
See who really holds power in Latin America
Click to open the Power Map

Rotate for Best Experience

This report is optimized for landscape viewing. Rotate your phone for the full experience.