Alupar Q2 IFRS Profit Near Triples to US$82M; Regulatory Profit Falls
Brazil · Business
Key Facts
—IFRS profit surged. Net income attributable to Alupar shareholders rose 187.6% to R$416.6 million (US$81.7 million).
—Regulatory profit moved the other way. The regulatory measure fell 14.6% to R$159.0 million (US$31.2 million), from R$186.1 million (US$36.5 million).
—Operating revenue expanded. Regulatory net revenue grew 10.3% to R$946.1 million (US$185.4 million).
—EBITDA rose more slowly. Regulatory EBITDA increased 6.5% to R$724.7 million (US$142.1 million), and its margin declined to 76.6%.
—Leverage improved. Net debt to EBITDA fell to 3.2 times from 3.4 times a year earlier, despite higher absolute debt.
—A dividend was approved. Alupar will distribute R$69.2 million (US$13.6 million), equal to R$0.21 (about US$0.04) per ALUP11 unit.
Alupar’s headline profit boom and its underlying earnings decline are both correct: IFRS project accounting lifted the statutory result, while the regulatory view showed how interest costs still constrain recurring cash earnings.
The second quarter reinforced Alupar’s core strength as a power-transmission developer and operator, but it also demonstrated why investors cannot read a single profit number in isolation. The Brazilian utility reports both IFRS and regulatory results, and the two frameworks produced opposite year-on-year directions.
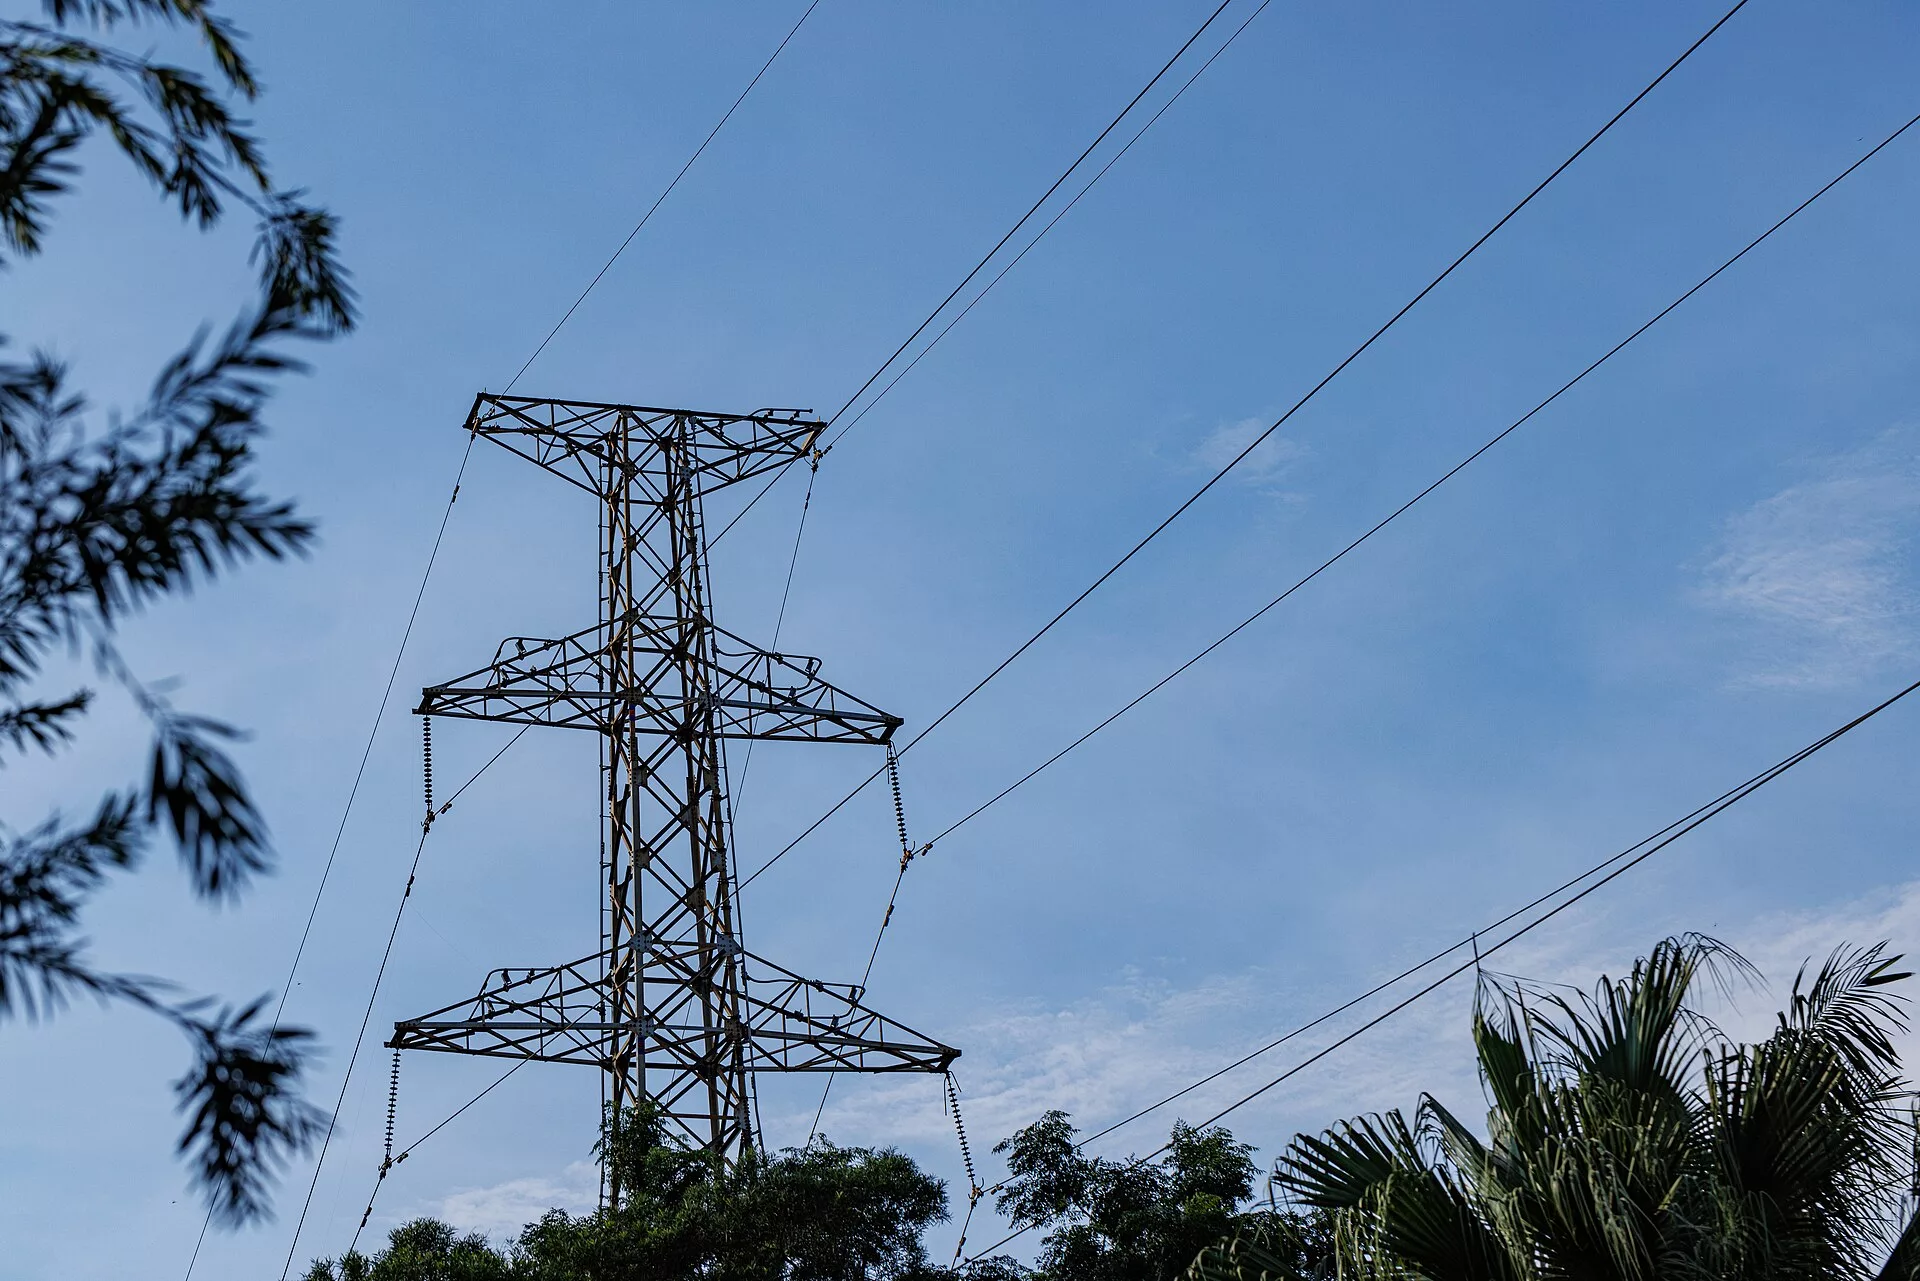
IFRS and Regulatory Profit Tell Different Stories
Under IFRS, net income attributable to Alupar shareholders reached R$416.6 million (US$81.7 million), up 187.6% from R$144.9 million (US$28.4 million) in Q2 2025. The statutory framework recognizes construction revenue and the remeasurement of contractual assets in transmission concessions, so earnings can move sharply as projects advance and discount assumptions change.
The regulatory view, which is closer to the cash-generation profile of operating concessions, produced attributable profit of R$159.0 million (US$31.2 million). That was 14.6% below R$186.1 million (US$36.5 million) a year earlier. Higher financial expenses and inflation-linked debt weighed on this measure even as operating revenue and EBITDA increased.
Neither figure is inherently wrong. IFRS is the statutory accounting result and captures the economic value created during construction. Regulatory accounting strips away much of that timing effect and is therefore often more useful for assessing the recurring capacity of mature transmission and generation assets to service debt and pay dividends.
| Metric | Q2 2026 | Year on year |
|---|---|---|
| IFRS attributable profit | R$416.6m / US$81.7m | +187.6% |
| Regulatory attributable profit | R$159.0m / US$31.2m | −14.6% |
| Regulatory net revenue | R$946.1m / US$185.4m | +10.3% |
| Regulatory EBITDA | R$724.7m / US$142.1m | +6.5% |
| Regulatory EBITDA margin | 76.6% | −2.7 pp |
| Net debt / EBITDA | 3.2× | From 3.4× |
Transmission Remained the Quality Core
Regulatory net revenue increased 10.3% to R$946.1 million (US$185.4 million), while regulatory EBITDA rose 6.5% to R$724.7 million (US$142.1 million). The margin fell to 76.6% from 79.3%, showing that costs and the changing project mix absorbed part of the revenue gain.
Transmission delivered the most dependable performance. Regulatory revenue in the segment rose about 15%, and EBITDA increased 12.7%, with a margin still close to 90%. Annual permitted revenue adjustments and the commissioning of new assets supported the expansion.
That predictability is central to Alupar’s investment case. Transmission concessions receive contracted availability-based revenue rather than depending primarily on the amount of electricity transported, which reduces exposure to power prices and demand swings. The trade-off is heavy upfront investment and a long period of debt-funded construction.
Debt Grew, but Operating Coverage Improved
Net debt reached about R$9.49 billion (US$1.86 billion), roughly 5% above the prior-year level. Even so, net debt to EBITDA improved to 3.2 times from 3.4 times because operating cash earnings grew faster than indebtedness.
More than 60% of the debt is indexed to Brazil’s IPCA inflation measure. That structure matches the inflation-linked revenue of many concessions over time, but it can create quarterly pressure when monetary correction raises financial expenses before tariff adjustments fully flow through earnings.
Most maturities remain long term and are housed within operating or construction-stage subsidiaries whose payment schedules are designed around each project’s cash generation. Investors should nevertheless watch whether the new-project pipeline continues improving consolidated EBITDA fast enough to keep leverage moving down.
Dividend Confirms Cash Distribution Despite the Split
The board approved R$69.2 million (US$13.6 million) in interim dividends. The payment equals R$0.07 (about US$0.01) per common or preferred share and R$0.21 (about US$0.04) per ALUP11 unit.
Shareholders recorded on August 13, 2026, will be entitled to the distribution. The securities trade ex-dividend from August 14, and payment is due by October 6. The modest quarterly payout reflects the balance between shareholder remuneration and the capital needs of a large transmission-development program.
What to Watch Next
Regulatory profit. The key test is whether financial expenses stabilize enough for operating growth to reach the bottom line.
Project commissioning. New transmission assets must move from construction accounting into recurring permitted revenue on schedule.
Leverage. A further decline from 3.2 times would show that the expansion cycle is strengthening rather than stretching the balance sheet.
Dividend capacity. Future distributions depend more on regulatory cash generation than on volatile IFRS construction gains.
More: Brazil news, every day from The Rio Times.
Frequently Asked Questions
What was Alupar’s IFRS profit in Q2 2026?
IFRS net income attributable to Alupar shareholders rose 187.6% to R$416.6 million (US$81.7 million).
Why did Alupar’s regulatory profit fall?
Regulatory profit declined 14.6% to R$159.0 million (US$31.2 million) as higher financial expenses offset stronger transmission revenue and EBITDA.
Why are Alupar’s IFRS and regulatory profits so different?
IFRS recognizes construction revenue and contractual-asset remeasurement, while regulatory reporting more closely reflects recurring cash earnings from operating concessions.
What was Alupar’s leverage?
Net debt to EBITDA improved to 3.2 times from 3.4 times a year earlier, although absolute net debt rose to about R$9.49 billion (US$1.86 billion).
How much dividend did Alupar approve?
Alupar approved R$69.2 million (US$13.6 million), equal to R$0.07 per common or preferred share and R$0.21 per ALUP11 unit.
Sources
- Alupar investor relations: official Q2 2026 results center
- Alupar investor relations: official Q2 2026 release and ITR downloads
- Alupar investor relations: dividends
- Central Bank of Brazil PTAX selling rate, August 6, 2026: R$5.1017 per US dollar.
This article was drafted with automated assistance and reviewed before publication. How we use AI · Report an error
Read More from The Rio Times