IBOV 172,457.76 ▲ 0.66% IPC MEX 71,204.98 ▼ 0.84% MERVAL 2,848,945 — — USD/BRL5.67▼ 0.02% USD/MXN18.52▼ 0.15% USD/CLP994.16▼ 0.13% USD/COP3,302▼ 0.37% USD/PEN3.40▼ 0.09% USD/ARS1,544▼ 0.02% USD/UYU40.59▲ 3.32% USD/PYG6,196▲ 3.06% USD/BOB11.59▲ 2.15% USD/DOP60.59▲ 0.26% USD/CRC442.74▲ 1.24% USD/GTQ7.64▲ 3.24% USD/HNL26.91▲ 3.28% USD/NIO 36.62 — 0.00% USD/VES911.74▼ 0.13% USD/PAB1.00— 0.00% USD/BZD2.00— 0.00% USD/JMD157.69▲ 2.75% USD/TTD6.75▲ 2.58% EUR/BRL6.25▲ 0.30% BRENT 95.71 ▼ 0.14% WTI 88.68 ▲ 0.14% IRON ORE 161.91 — — COPPER 6.07 ▼ 0.16% GOLD 3,892 ▲ 0.16% SILVER 48.66 ▼ 0.76% SOY 1,232 ▲ 0.37% CORN 445.50 ▲ 0.68% WHEAT 593.25 ▲ 1.54% COFFEE 279.25 ▼ 0.34% SUGAR 18.40 ▲ 0.99% ORANGE JUICE 136.85 ▼ 2.91% COTTON 78.68 ▲ 0.01% COCOA 5,123 ▲ 1.13% BEEF 224.80 ▲ 2.70% CATTLE 335.35 ▼ 0.10% LITHIUM 58.76 ▼ 1.13% PETR4 45.30 — 0.00% VALE3 63.50 — 0.00% ITUB4 42.27 — 0.00% BBDC4 14.52 — 0.00% ABEV3 15.79 — 0.00% BBAS3 15.10 — 0.00% B3SA3 14.89 ▲ 0.88% WEGE3 51.31 ▼ 0.66% PRIO3 63.30 — 0.00% SUZB3 54.77 — 0.00% RENT3 30.07 — 0.00% AZZA3 15.91 — 0.00% CSAN3 3.10 ▲ 8.77% RAIZ4 20.00 — 0.00% PCAR3 2.56 ▲ 7.11% GMAT3 4.25 ▲ 10.68% PSSA3 46.41 ▲ 1.02% CVCB3 0.83 ▼ 1.19% POSI3 3.15 ▼ 6.53% SLCE3 18.28 ▼ 0.44% NATU3 5.13 ▼ 3.75% BRKM5 3.02 — 0.00% RANI3 8.18 — 0.00% CSNA3 3.72 — 0.00% IBOV 172,457.76 ▲ 0.66% IPC MEX 71,204.98 ▼ 0.84% MERVAL 2,848,945 — — USD/BRL 5.67 ▼ 0.02% USD/MXN 18.53 ▼ 0.14% USD/CLP 994.16 ▼ 0.13% USD/COP 3,302 ▼ 0.37% USD/PEN 3.40 ▼ 0.09% USD/ARS 1,544 ▼ 0.02% USD/UYU 40.59 ▲ 3.32% USD/PYG 6,196 ▲ 3.06% USD/BOB 11.59 ▲ 2.15% USD/DOP 60.59 ▲ 0.26% USD/CRC 442.74 ▲ 1.24% USD/GTQ 7.64 ▲ 3.24% USD/HNL 26.91 ▲ 3.28% USD/NIO 36.62 — 0.00% USD/VES 911.74 ▼ 0.13% USD/PAB 1.00 — 0.00% USD/BZD 2.00 — 0.00% USD/JMD 157.69 ▲ 2.75% USD/TTD 6.75 ▲ 2.58% EUR/BRL 6.24 ▲ 0.29% BRENT 95.71 ▼ 0.14% WTI 88.68 ▲ 0.14% IRON ORE 161.91 — — COPPER 6.07 ▼ 0.16% GOLD 3,892 ▲ 0.16% SILVER 48.66 ▼ 0.76% SOY 1,232 ▲ 0.37% CORN 445.50 ▲ 0.68% WHEAT 593.25 ▲ 1.54% COFFEE 279.25 ▼ 0.34% SUGAR 18.40 ▲ 0.99% ORANGE JUICE 136.85 ▼ 2.91% COTTON 78.68 ▲ 0.01% COCOA 5,123 ▲ 1.13% BEEF 224.80 ▲ 2.70% CATTLE 335.35 ▼ 0.10% LITHIUM 58.76 ▼ 1.13% PETR4 45.30 — 0.00% VALE3 63.50 — 0.00% ITUB4 42.27 — 0.00% BBDC4 14.52 — 0.00% ABEV3 15.79 — 0.00% BBAS3 15.10 — 0.00% B3SA3 14.89 ▲ 0.88% WEGE3 51.31 ▼ 0.66% PRIO3 63.30 — 0.00% SUZB3 54.77 — 0.00% RENT3 30.07 — 0.00% AZZA3 15.91 — 0.00% CSAN3 3.10 ▲ 8.77% RAIZ4 20.00 — 0.00% PCAR3 2.56 ▲ 7.11% GMAT3 4.25 ▲ 10.68% PSSA3 46.41 ▲ 1.02% CVCB3 0.83 ▼ 1.19% POSI3 3.15 ▼ 6.53% SLCE3 18.28 ▼ 0.44% NATU3 5.13 ▼ 3.75% BRKM5 3.02 — 0.00% RANI3 8.18 — 0.00% CSNA3 3.72 — 0.00%
since 2009
Monday, November 16, 2026

Brazil Business - Brazil

Real Estate Prices in Brazil Soar Above Inflation in 2024: Coastal Cities Lead the Charge

By · · 2 min read

The Brazilian real estate market has experienced significant growth in 2024. Property prices in 56 cities tracked by the FipeZap Index rose by 0.71% in September.

This increase has contributed to a cumulative rise of 5.88% throughout the year. The surge outpaces the inflation rate of 2.99% as measured by the IPCA.

Santa Catarina dominates the list of cities with the most expensive real estate. Balneário Camboriú maintains its position at the top, with properties costing R$ 13,593 ($2,471) per square meter.

Free daily brief — no card needed
Get every Brazil story in one morning email
We build you a personalized brief around the topics you follow — free for 7 days. Love it? Your first month after that is US$1.

Itapema follows closely behind at R$ 13,573 ($2,467), while Itajaí rounds out the top three at R$ 11,608 ($2,110). Among state capitals, Florianópolis leads with a square meter price of R$ 11,604 ($2,109).

Other capitals have seen substantial price increases in 2024. Curitiba tops the list with a 14.19% rise, followed by João Pessoa at 13.26% and Salvador at 12.92%.
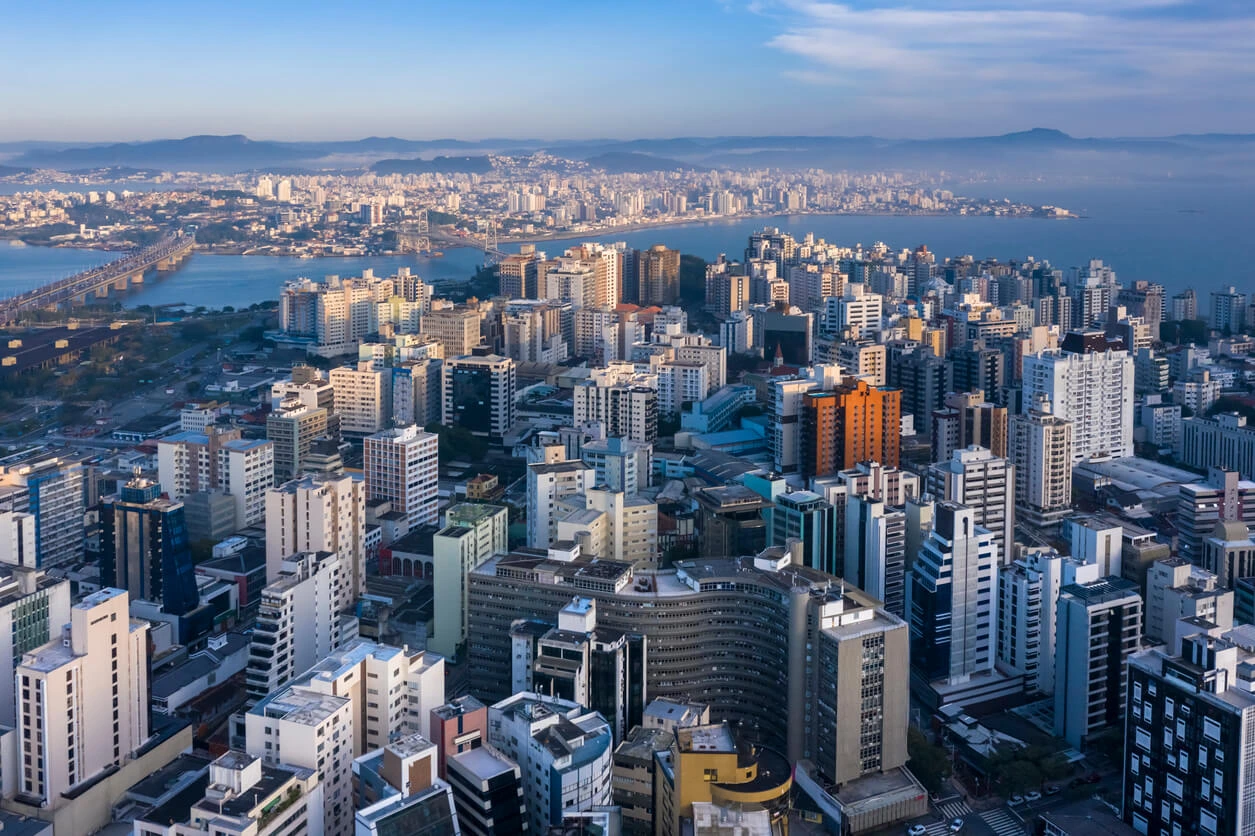
Real Estate Prices in Brazil Soar Above Inflation in 2024: Coastal Cities Lead the Charge
Real Estate Prices in Brazil Soar Above Inflation in 2024: Coastal Cities Lead the Charge.

The national average price for sold properties stands at R$ 9,208 ($1,674) per square meter. This figure reflects the overall trend of rising real estate values across the country.

Brazil’s Real Estate Market

Over the past 12 months, property sale prices have increased by 7.15%. These price hikes significantly outpace the IPCA-measured inflation rate of 4.10% for the same period.

The disparity between real estate growth and general inflation highlights the robust nature of Brazil’s property market. This trend suggests a strong demand for housing and investment properties throughout the country.

Experts attribute this growth to various factors, including low interest rates and increased demand for larger living spaces.

The COVID-19 pandemic has also influenced housing preferences, with many seeking homes that accommodate remote work.

As the real estate market continues to evolve, potential buyers and investors are closely monitoring these trends. The sustained growth in property values presents both opportunities and challenges for Brazil’s housing sector.

Live Market IntelligenceBrazil — Live Market BoardInside: market breadth, the sector heatmap, currencies & rates, the Latin America scoreboard and the full instrument board.

Rio Times · Live Market Intelligence

Brazil — Live Market Board

B3 · São Paulo
Nov 15, 2026 · 21:56

Ibovespa · benchmark
172,457.76
+0.66%
+9.73% over 12 months

Market breadth · 2 names
50% advancing

1 ▲ advancing1 declining ▼

Currencies, rates & key inputs
USD / BRL
5.67
-0.02%

EUR / BRL
6.24
+0.29%

Selic rate
13.75%
·

Brent crude
95.71
-0.14%

Iron ore
161.91
·

Sector heatmap · average move today
Financials
+0.22%
ITUB4, BBDC4, BBAS3, B3SA3

Energy
0.00%
PETR4, PRIO3

Mining
0.00%
VALE3, CSNA3, GGBR4

Consumer Staples
0.00%
ABEV3

Materials
0.00%
SUZB3

Consumer Disc.
0.00%
AZZA3

Utilities
0.00%
ENEV3

Industrials
-0.33%
WEGE3, RENT3

Latin America scoreboard
IndexLastTodayStrength
IbovespaBrazil
172,457.76
+0.66%

S&P/BMV IPCMexico
71,204.98
-0.84%

S&P IPSAChile
10,660.26
+0.33%

S&P MERVALArgentina
2,848,945
—

MSCI COLCAPColombia
2,452.46
-0.02%

Full instrument board
Instrument Last Change YoY Prev. High Low Volume
IBOV 172,457.76 +0.66% +9.73% 171,324.31 — — —
USD/BRL 5.67 -0.02% +7.01% 5.67 5.67 5.64 —
SELIC 13.75% — — — — —
PETR4 45.30 +0.00% +39.43% 45.30 45.30 — —
VALE3 63.50 +0.00% -3.30% 63.50 63.50 — —
ITUB4 42.27 +0.00% +7.66% 42.27 42.27 — —
BBDC4 14.52 +0.00% -25.46% 14.52 14.52 — —
BBAS3 15.10 +0.00% -32.89% 15.10 15.10 — —
B3SA3 14.89 +0.88% +2.90% 14.76 14.94 14.53 34,792,900
ABEV3 15.79 +0.00% +15.85% 15.79 15.79 — —
WEGE3 51.31 -0.66% +14.48% 51.65 52.05 50.93 7,741,000
PRIO3 63.30 +0.00% +58.93% 63.30 63.30 — —
SUZB3 54.77 +0.00% +14.92% 54.77 54.77 — —
RENT3 30.07 +0.00% -28.47% 30.07 30.07 — —
AZZA3 15.91 +0.00% -45.85% 15.91 15.91 — —
CSNA3 3.72 +0.00% -56.79% 3.72 3.72 — —
GGBR4 24.73 +0.00% +30.78% 24.73 24.73 — —
ENEV3 26.81 +0.00% +38.98% 26.81 26.81 — —

Largest moves today
B3SA3
14.89
+0.88%
IBOV
172,457.76
+0.66%
WEGE3
51.31
-0.66%
USD/BRL
5.67
-0.02%
SELIC
13.75%
PETR4
45.30
+0.00%
VALE3
63.50
+0.00%
ITUB4
42.27
+0.00%

The session read
The Ibovespa rose 0.66%, with breadth evenly split — 1 of 2 names higher. Financials led, while Industrials lagged.

This article was produced by The Rio Times’ automated AI newsroom. Editorial responsibility: Matthias Camenzind, Publisher and Editor-in-Chief. The Rio Times also runs Ask Rio Times, which answers from 100,000+ of our own articles, the daily Latin America Power Map, and prediction-market odds on elections and markets.. How we use AI · Report an error

The Rio Times · Power Map
See who really holds power in Latin America
Click to open the Power Map →

Brazil runoff date: Sunday, October 25, poll closing times and when results start · Brazil runoff polls: Flávio 51%, Lula 49% · Kalshi and Polymarket odds

Rotate for Best Experience

This report is optimized for landscape viewing. Rotate your phone for the full experience.