IBOV 187,206.89 ▼ 0.56% IPSA 11,220.10 ▼ 0.16% IPC MEX 63,924.77 ▼ 0.28% MERVAL 3,098,898 ▼ 1.87% COLCAP 2,589.69 ▼ 1.41% BVL PERÚ 59,373.28 ▼ 0.32% USD/BRL5.13— 0.00% USD/MXN16.96▼ 0.01% USD/CLP941.13— 0.00% USD/COP3,077▼ 0.78% USD/PEN3.35▼ 0.01% USD/ARS1,509— 0.00% USD/UYU40.26▲ 3.12% USD/PYG5,903▲ 3.35% USD/BOB11.98▼ 2.70% USD/DOP58.96▲ 0.56% USD/CRC447.55▲ 1.64% USD/GTQ7.63▲ 2.97% USD/HNL26.85▲ 3.13% USD/NIO36.62▲ 2.58% USD/VES830.41▼ 1.28% USD/PAB1.00— 0.00% USD/BZD2.00— 0.00% USD/JMD 157.28 — 0.00% USD/TTD6.74▲ 2.35% EUR/BRL5.94▲ 0.19% BRENT 88.88 ▼ 0.03% WTI 83.11 ▼ 0.11% IRON ORE 161.91 — — COPPER 6.61 ▲ 0.03% GOLD 4,461 ▲ 1.78% SILVER 65.59 ▲ 1.26% SOY 1,184 ▲ 3.20% CORN 480.50 ▲ 10.02% WHEAT 655.00 ▲ 3.93% COFFEE 317.25 ▼ 5.51% SUGAR 16.43 ▼ 1.79% ORANGE JUICE 138.55 ▼ 0.47% COTTON 85.03 ▲ 2.33% COCOA 5,719 ▲ 3.18% BEEF 223.60 ▼ 3.93% CATTLE 339.10 ▼ 3.16% LITHIUM 75.20 ▲ 1.47% PETR4 41.64 ▼ 0.05% VALE3 72.97 ▲ 0.83% ITUB4 38.60 ▼ 1.03% BBDC4 16.85 ▲ 0.36% ABEV3 14.89 ▼ 0.80% BBAS3 19.37 ▲ 0.47% B3SA3 14.26 ▼ 0.21% WEGE3 47.59 ▲ 0.49% PRIO3 59.14 ▼ 0.19% SUZB3 41.33 ▲ 2.35% RENT3 34.68 ▼ 0.09% AZZA3 15.89 ▼ 2.63% CSAN3 3.22 ▼ 1.83% RAIZ4 0.25 — 0.00% PCAR3 2.75 ▼ 0.36% GMAT3 3.65 ▼ 1.08% PSSA3 48.13 ▼ 0.54% CVCB3 1.33 ▼ 2.92% POSI3 3.36 ▲ 2.44% SLCE3 13.34 ▲ 0.30% NATU3 8.14 ▼ 0.73% IBOV 187,206.89 ▼ 0.56% IPSA 11,220.10 ▼ 0.16% IPC MEX 63,924.77 ▼ 0.28% MERVAL 3,098,898 ▼ 1.87% COLCAP 2,589.69 ▼ 1.41% BVL PERÚ 59,373.28 ▼ 0.32% USD/BRL 5.16 ▲ 0.01% USD/MXN 17.06 ▼ 0.24% USD/CLP 913.98 ▲ 0.04% USD/COP 3,140 ▲ 0.03% USD/PEN 3.36 ▼ 0.66% USD/ARS 1,493 ▲ 0.10% USD/UYU 40.27 ▲ 1.24% USD/PYG 5,939 ▲ 1.68% USD/BOB 11.64 ▼ 0.76% USD/DOP 58.34 ▲ 1.25% USD/CRC 445.92 ▲ 0.89% USD/GTQ 7.62 ▲ 2.21% USD/HNL 26.79 ▲ 1.57% USD/NIO 36.62 ▲ 0.69% USD/VES 762.44 ▼ 0.13% USD/PAB 1.00 — 0.00% USD/BZD 2.00 — 0.00% USD/JMD 157.28 — 0.00% USD/TTD 6.70 ▲ 0.61% EUR/BRL 5.95 ▲ 1.01% BRENT 88.88 ▼ 0.03% WTI 83.11 ▼ 0.11% IRON ORE 161.91 — — COPPER 6.61 ▲ 0.03% GOLD 4,461 ▲ 1.78% SILVER 65.59 ▲ 1.26% SOY 1,184 ▲ 3.20% CORN 480.50 ▲ 10.02% WHEAT 655.00 ▲ 3.93% COFFEE 317.25 ▼ 5.51% SUGAR 16.43 ▼ 1.79% ORANGE JUICE 138.55 ▼ 0.47% COTTON 85.03 ▲ 2.33% COCOA 5,719 ▲ 3.18% BEEF 223.60 ▼ 3.93% CATTLE 339.10 ▼ 3.16% LITHIUM 75.20 ▲ 1.47% PETR4 41.64 ▼ 0.05% VALE3 72.97 ▲ 0.83% ITUB4 38.60 ▼ 1.03% BBDC4 16.85 ▲ 0.36% ABEV3 14.89 ▼ 0.80% BBAS3 19.37 ▲ 0.47% B3SA3 14.26 ▼ 0.21% WEGE3 47.59 ▲ 0.49% PRIO3 59.14 ▼ 0.19% SUZB3 41.33 ▲ 2.35% RENT3 34.68 ▼ 0.09% AZZA3 15.89 ▼ 2.63% CSAN3 3.22 ▼ 1.83% RAIZ4 0.25 — 0.00% PCAR3 2.75 ▼ 0.36% GMAT3 3.65 ▼ 1.08% PSSA3 48.13 ▼ 0.54% CVCB3 1.33 ▼ 2.92% POSI3 3.36 ▲ 2.44% SLCE3 13.34 ▲ 0.30% NATU3 8.14 ▼ 0.73%
since 2009
Saturday, September 12, 2026

Latin America Life & Society

Latin American Housing Prices Soar: Colombia and Mexico Lead the Charge

By · October 4, 2024 · 2 min read

The LatAm Brief

One email, every weekday morning. What moved in Latin American markets, politics and expat life.

Yesterday’s subject line: “'The false peace is over' - Colombia”

Free. We send a confirmation link first — nothing arrives until you click it. Unsubscribe with one click in any edition. If you stop opening us for 30 days we stop sending by ourselves, as we assume the interest is no longer there. See our privacy policy. We never share your email.

The Latin American housing market is experiencing a significant uptick, with Colombia and Mexico at the forefront of this trend.

Knight Frank’s Global House Price Index reveals a 3.3% increase in housing prices across 56 countries over the past year.

Colombia ranks sixth globally, boasting a 10.9% annual price growth, while Mexico follows closely in eighth place with a 9.4% increase.

This surge comes as interest rates begin to fall and inflation pressures persist in the region. The global housing market has shown signs of strengthening, with 74% of markets recording price increases in the last quarter.

This figure represents the highest percentage in two years, indicating a robust recovery from the pandemic-induced slowdown. Liam Bailey, Knight Frank’s Global Head of Research, attributes this growth to interest rate cuts.
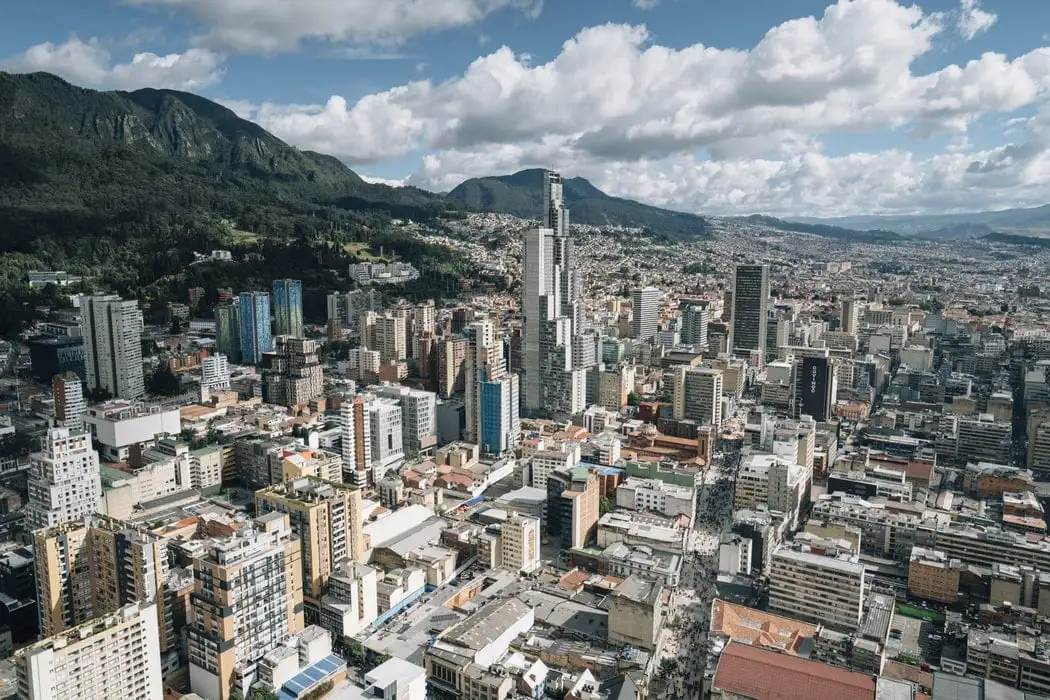
Latin American Housing Prices Soar: Colombia and Mexico Lead the Charge
Latin American Housing Prices Soar: Colombia and Mexico Lead the Charge.
One-stop reference
Company Intelligence
Every listed company in Latin America — financials, ownership and structure for 1,450+ companies across 26 exchanges, in one place.
Browse the directory →
RT
Ask Rio Times
17 years of Latin America reporting, on demand.
Open the full Ask Rio Times →

He notes that while central banks’ actions will limit the pace of price increases, government interventions are becoming more common. Regulators are actively working to improve market access and boost housing construction volumes.

Brazil also features prominently in the index, securing the 19th position with a 6.2% price increase. Peru and Chile follow suit, ranking 34th and 45th, respectively.

Peru saw a modest 2.3% rise, while Chile experienced a slight decline of 0.7%. The construction sector has faced challenges since the pandemic, grappling with weakened household finances and high inflation.

However, some countries are now showing signs of recovery. In Colombia, new home sales reached 12,653 units in August, marking a 5.68% increase from the previous year.

Globally, Turkey leads the pack with a staggering 46.4% price increase, followed by Poland at 18% and Bulgaria at 15.1%.

On the other end of the spectrum, Hong Kong saw the steepest decline at -12.7%, with Luxembourg and Jersey also experiencing significant drops.

This trend in Latin America reflects a broader global pattern of rising housing prices. As economies recover from the pandemic and monetary policies adjust, the real estate market is responding with increased vigor.

The situation presents both opportunities and challenges for the region’s housing sector and overall economic landscape.

Top 20 Countries with Highest Nominal Year-over-Year House Price Growth

1. Türkiye: 167.9%
2. Serbia: 23.1%
3. Russia: 23.1%
4. North Macedonia: 20.6%
5. Iceland: 20.3%
6. Croatia: 17.3%
7. Estonia: 16.9%
8. Israel: 16.8%
9. Hungary: 16.5%
10. Lithuania: 16.0%
11. Slovenia: 15.4%
12. Bulgaria: 13.4%
13. Greece: 12.2%
14. Portugal: 11.3%
15. United Kingdom: 10.0%
16. Slovak Republic: 9.7%
17. United Arab Emirates: 9.6%
18. Poland: 9.3%
19. Latvia: 9.1%
20. Singapore: 8.6%

At the other end of the spectrum, some countries experienced price decreases:

  • China: -3.7%
  • Canada: -3.8%
  • New Zealand: -10.4%
  • Hong Kong SAR: -13.5%

This article was drafted with automated assistance and reviewed before publication. How we use AI · Report an error

Read More from The Rio Times

The Rio Times · Power Map
See who really holds power in Latin America
Click to open the Power Map

Rotate for Best Experience

This report is optimized for landscape viewing. Rotate your phone for the full experience.