PISA 2025: Argentina’s Worst Result Since 2006, Chile Slips
LATIN AMERICA · EDUCATION
Key Facts
- —What happened OECD published the PISA 2025 results on 8 September 2026, covering 91 countries and over 760,000 students.
- —Argentina Reading 389, maths 367, science 393. Its worst showing in all three since 2006.
- —Chile Reading fell 12 points to 436 and maths 9 points to 403. Science was roughly flat at 442.
- —The catch Only 41 percent of Chilean students reach the basic maths level, against 65 percent across the OECD.
- —Mexico and Brazil Mexico slipped to 408 in reading and 388 in maths. Brazil was broadly stable at 408, 377 and 409.
- —Spain Its weakest result since PISA began in 2000, down 23 points in reading and 16 in maths.
The PISA 2025 tables landed on Tuesday. Latin America went backwards almost everywhere, and so did Spain.
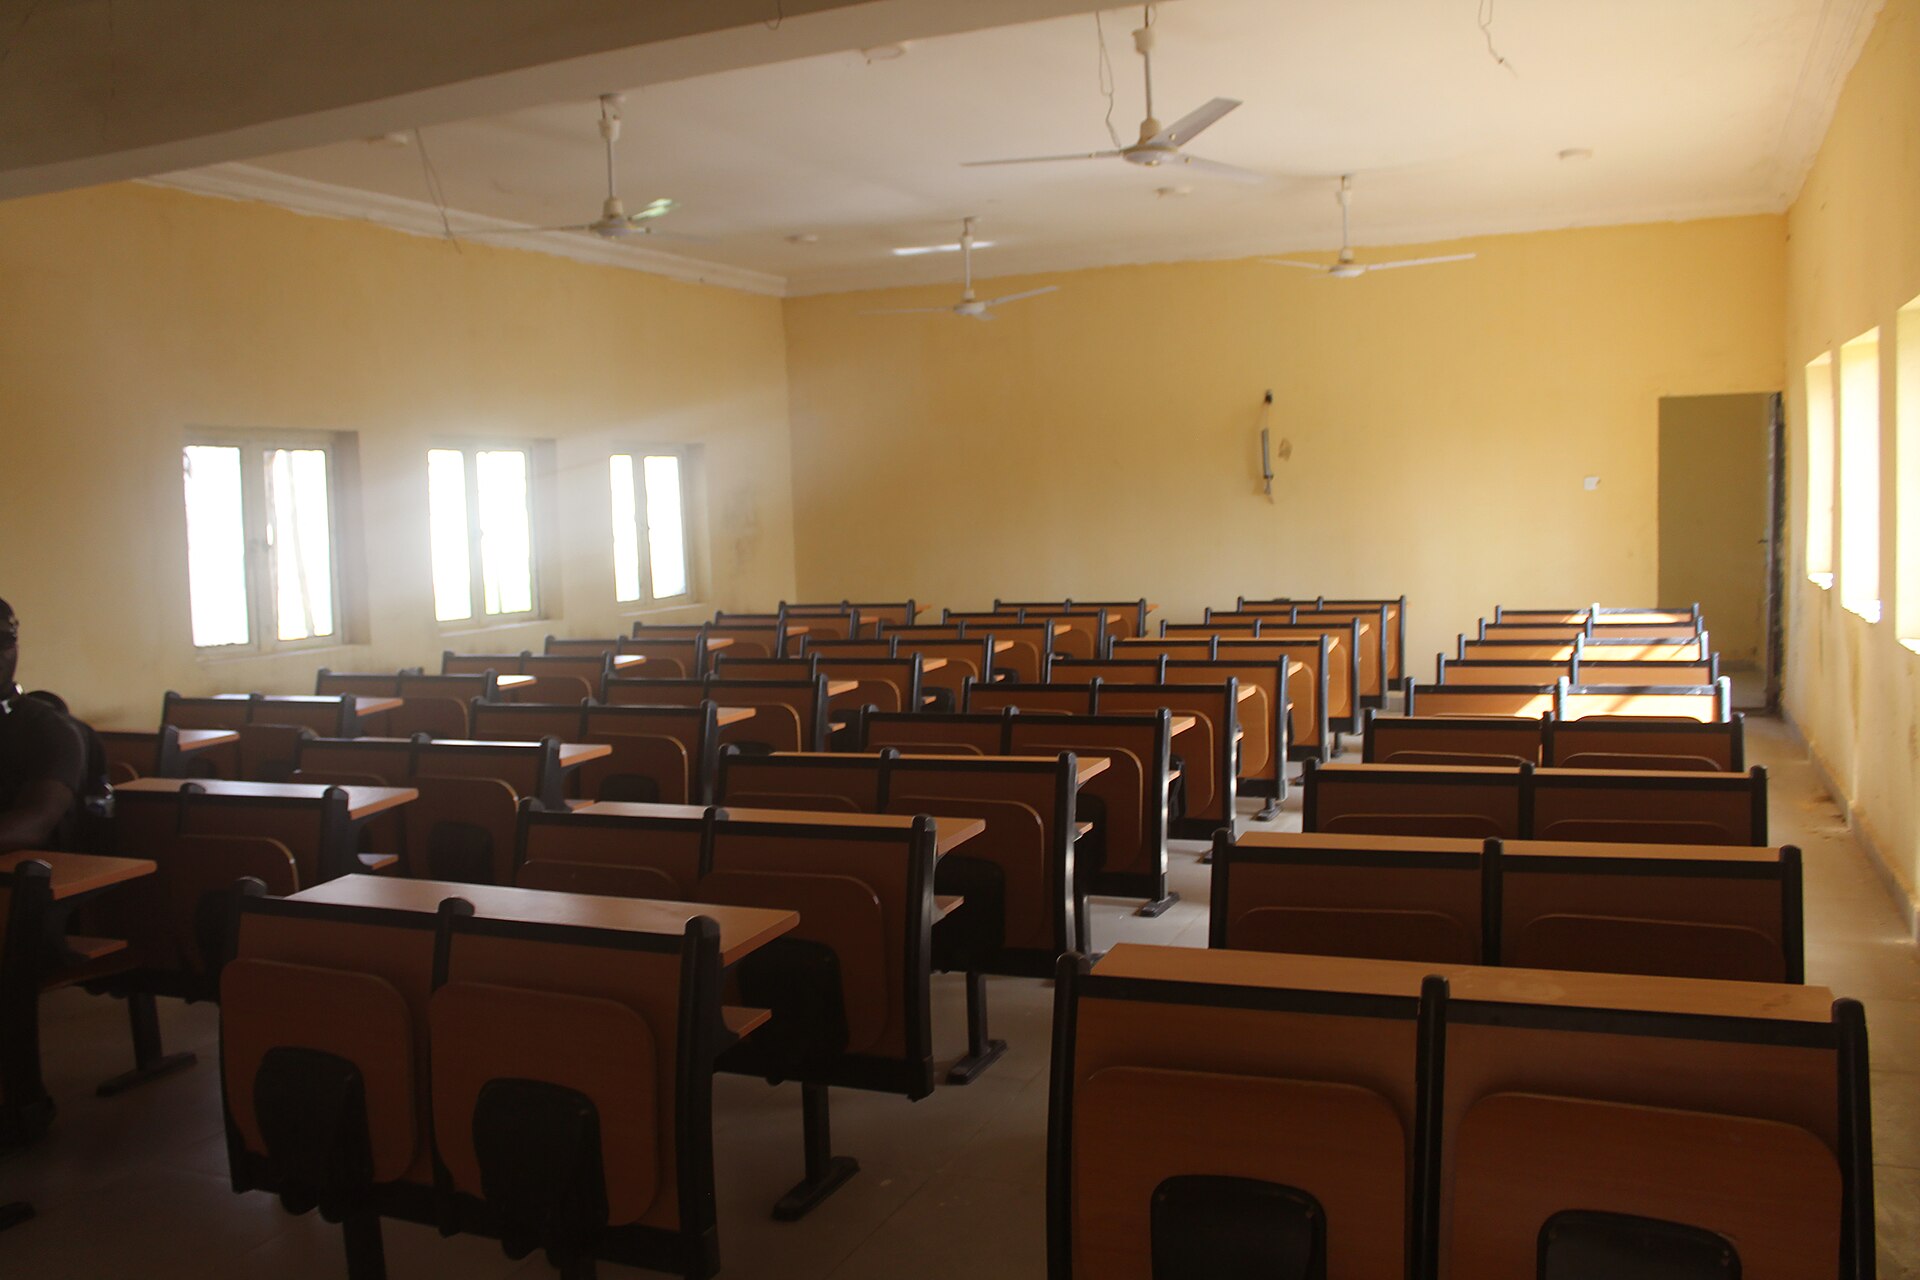
The PISA 2025 results were published on Tuesday. Most of Latin America went backwards.
The round covered 91 countries and more than 760,000 students. The OECD averages were 461 in reading, 463 in maths and 482 in science.
Every Latin American country tested sits below all three. The gap is widest in mathematics.
Spain, often used as a reference point in the region, posted its weakest result since the programme began in 2000.
What PISA 2025 Says About Argentina
Argentina scored 389 in reading, 367 in maths and 393 in science. Infobae reports these as its worst results in all three since 2006.
Globally it ranks 62nd in reading, 75th in maths and 71st in science. Within Latin America it is eighth of thirteen in every subject.
The proportion figures are starker than the scores. Some 76 percent of Argentine students fall below the basic level in mathematics.
In reading and science the figure is 59 percent. The government has blamed previous administrations.
Chile Falls From a Higher Base
Chile remains the strongest performer in the region on these tables. It also fell.
Reading dropped 12 points from 448 to 436, and maths 9 points from 412 to 403. Science was broadly flat at 442.
Only 41 percent of Chilean students reach the basic level in mathematics. Across the OECD the figure is 65 percent.
Chile has the second-best science result in Latin America. Uruguay is ahead of it at 445.
Mexico and Brazil
Mexico fell from 415 to 408 in reading and from 395 to 388 in maths. The maths figure is its lowest since 2006.
Thirty percent of Mexican students reach the basic maths level. The Mexican press has described the round as an educational failure.
Brazil was the steadier case. It recorded 408 in reading, 377 in maths and 409 in science, broadly in line with its previous round.
Stability at a low level is not the same as progress. Brazil remains well below the OECD average in all three.
What the Numbers Do Not Tell You
PISA measures fifteen-year-olds who are in school. In countries with high dropout rates that excludes part of the cohort.
That flatters the results of systems that lose more students before the test. Comparisons between countries with different retention rates are not like for like.
The trend within a country over time is the more reliable reading. On that measure Argentina’s is the clearest signal in this round.
What to Watch
The first marker is what governments do with it. PISA rounds usually produce a policy response and rarely a sustained one.
The second is the pandemic question. This cohort was in primary school during school closures, and the region closed schools for longer than most.
The third is the next round. A single fall can be noise, and two consecutive falls cannot.
More: Latin America news in English, every day from The Rio Times.
Frequently Asked Questions
How did Argentina do?
Reading 389, maths 367 and science 393, its worst results in all three since 2006. It ranks 62nd in reading, 75th in maths and 71st in science globally, and eighth of thirteen in Latin America.
Did Chile fall too?
Yes. Reading dropped 12 points to 436 and maths 9 points to 403, while science was broadly flat at 442. Only 41 percent of Chilean students reach the basic maths level against 65 percent across the OECD.
What about Mexico and Brazil?
Mexico fell to 408 in reading and 388 in maths, its lowest maths score since 2006. Brazil was broadly stable at 408 in reading, 377 in maths and 409 in science.
Sources: OECD, Infobae, Canal 26, Emol, BBC Mundo, Euronews, Rio Times.
This article was produced by The Rio Times’ automated newsroom system. How we use AI · Report an error
Read More from The Rio Times