IBOV 171,324.31 ▼ 0.43% IPC MEX 71,674.32 ▼ 0.46% MERVAL 2,848,945 — — USD/BRL5.64▲ 1.06% USD/MXN18.57▼ 0.18% USD/CLP994.00▲ 1.14% USD/COP3,302▼ 0.16% USD/PEN3.41▼ 0.06% USD/ARS1,545▲ 0.03% USD/UYU40.52▲ 3.32% USD/PYG6,185▲ 3.33% USD/BOB11.60▲ 0.86% USD/DOP60.47▲ 0.03% USD/CRC445.25▲ 1.62% USD/GTQ7.65▲ 3.31% USD/HNL26.90▲ 3.30% USD/NIO36.62▲ 2.73% USD/VES909.35▲ 0.67% USD/PAB1.00— 0.00% USD/BZD2.00— 0.00% USD/JMD157.09▲ 2.15% USD/TTD6.71▲ 2.19% EUR/BRL6.24▲ 0.10% BRENT 95.41 ▲ 2.86% WTI 88.32 ▲ 2.07% IRON ORE 161.91 — — COPPER 6.24 ▼ 0.63% GOLD 3,917 ▼ 2.08% SILVER 50.61 ▼ 2.46% SOY 1,225 ▼ 0.35% CORN 445.50 ▼ 0.56% WHEAT 588.50 ▼ 1.83% COFFEE 275.10 ▲ 2.27% SUGAR 18.22 ▼ 1.41% ORANGE JUICE 140.60 ▼ 0.25% COTTON 78.56 ▲ 0.05% COCOA 5,187 ▲ 5.71% BEEF 223.05 ▲ 1.86% CATTLE 331.80 ▼ 0.25% LITHIUM 59.43 ▼ 0.92% PETR4 44.70 ▲ 2.64% VALE3 63.95 ▼ 0.75% ITUB4 41.68 ▼ 0.10% BBDC4 14.32 ▼ 0.07% ABEV3 15.75 ▼ 0.63% BBAS3 15.48 ▼ 8.35% B3SA3 14.76 ▼ 0.27% WEGE3 51.65 ▲ 0.08% PRIO3 63.30 ▲ 2.98% SUZB3 56.04 ▲ 4.16% RENT3 29.58 ▼ 2.18% AZZA3 16.90 ▲ 9.95% CSAN3 2.85 ▼ 5.94% RAIZ4 0.30 ▼ 98.60% PCAR3 2.39 ▼ 5.91% GMAT3 3.84 ▼ 5.88% PSSA3 45.94 ▼ 0.09% CVCB3 0.84 ▼ 2.33% POSI3 3.37 ▲ 1.51% SLCE3 18.36 ▲ 7.68% NATU3 5.33 ▼ 5.16% BRKM5 3.07 ▲ 5.14% RANI3 8.18 ▼ 2.50% CSNA3 4.23 ▼ 6.42% IBOV 171,324.31 ▼ 0.43% IPC MEX 71,674.32 ▼ 0.46% MERVAL 2,848,945 — — USD/BRL 5.64 ▲ 1.06% USD/MXN 18.58 ▼ 0.14% USD/CLP 994.00 ▲ 1.14% USD/COP 3,302 ▼ 0.16% USD/PEN 3.41 ▼ 0.06% USD/ARS 1,545 ▲ 0.03% USD/UYU 40.52 ▲ 3.32% USD/PYG 6,185 ▲ 3.33% USD/BOB 11.60 ▲ 0.86% USD/DOP 60.47 ▲ 0.03% USD/CRC 445.25 ▲ 1.62% USD/GTQ 7.65 ▲ 3.31% USD/HNL 26.90 ▲ 3.30% USD/NIO 36.62 ▲ 2.73% USD/VES 909.35 ▲ 0.67% USD/PAB 1.00 — 0.00% USD/BZD 2.00 — 0.00% USD/JMD 157.09 ▲ 1.00% USD/TTD 6.71 ▲ 1.04% EUR/BRL 6.24 ▲ 0.10% BRENT 95.41 ▲ 2.86% WTI 88.32 ▲ 2.07% IRON ORE 161.91 — — COPPER 6.24 ▼ 0.63% GOLD 3,917 ▼ 2.08% SILVER 50.61 ▼ 2.46% SOY 1,225 ▼ 0.35% CORN 445.50 ▼ 0.56% WHEAT 588.50 ▼ 1.83% COFFEE 275.10 ▲ 2.27% SUGAR 18.22 ▼ 1.41% ORANGE JUICE 140.60 ▼ 0.25% COTTON 78.56 ▲ 0.05% COCOA 5,187 ▲ 5.71% BEEF 223.05 ▲ 1.86% CATTLE 331.80 ▼ 0.25% LITHIUM 59.43 ▼ 0.92% PETR4 44.70 ▲ 2.64% VALE3 63.95 ▼ 0.75% ITUB4 41.68 ▼ 0.10% BBDC4 14.32 ▼ 0.07% ABEV3 15.75 ▼ 0.63% BBAS3 15.48 ▼ 8.35% B3SA3 14.76 ▼ 0.27% WEGE3 51.65 ▲ 0.08% PRIO3 63.30 ▲ 2.98% SUZB3 56.04 ▲ 4.16% RENT3 29.58 ▼ 2.18% AZZA3 16.90 ▲ 9.95% CSAN3 2.85 ▼ 5.94% RAIZ4 0.30 ▼ 98.60% PCAR3 2.39 ▼ 5.91% GMAT3 3.84 ▼ 5.88% PSSA3 45.94 ▼ 0.09% CVCB3 0.84 ▼ 2.33% POSI3 3.37 ▲ 1.51% SLCE3 18.36 ▲ 7.68% NATU3 5.33 ▼ 5.16% BRKM5 3.07 ▲ 5.14% RANI3 8.18 ▼ 2.50% CSNA3 4.23 ▼ 6.42%
since 2009
Friday, November 13, 2026

July Industrial Goods Consumption Indicator Shows 2.6 Percent Increase over June

By · · 2 min read

RIO DE JANEIRO, BRAZIL – The Monthly IPEA Indicator of Apparent Consumption of Industrial Goods, which measures domestic demand in the sector, recorded an increase of 2.6 percent in the comparison between the months of July and June, in the seasonally adjusted series. Following a 0.2 percent retreat in the previous period, the quarter ending in July closed with a 1.8 percent growth margin.

The indicator is characterized by domestic industrial production, discounting exports and increasing imports.
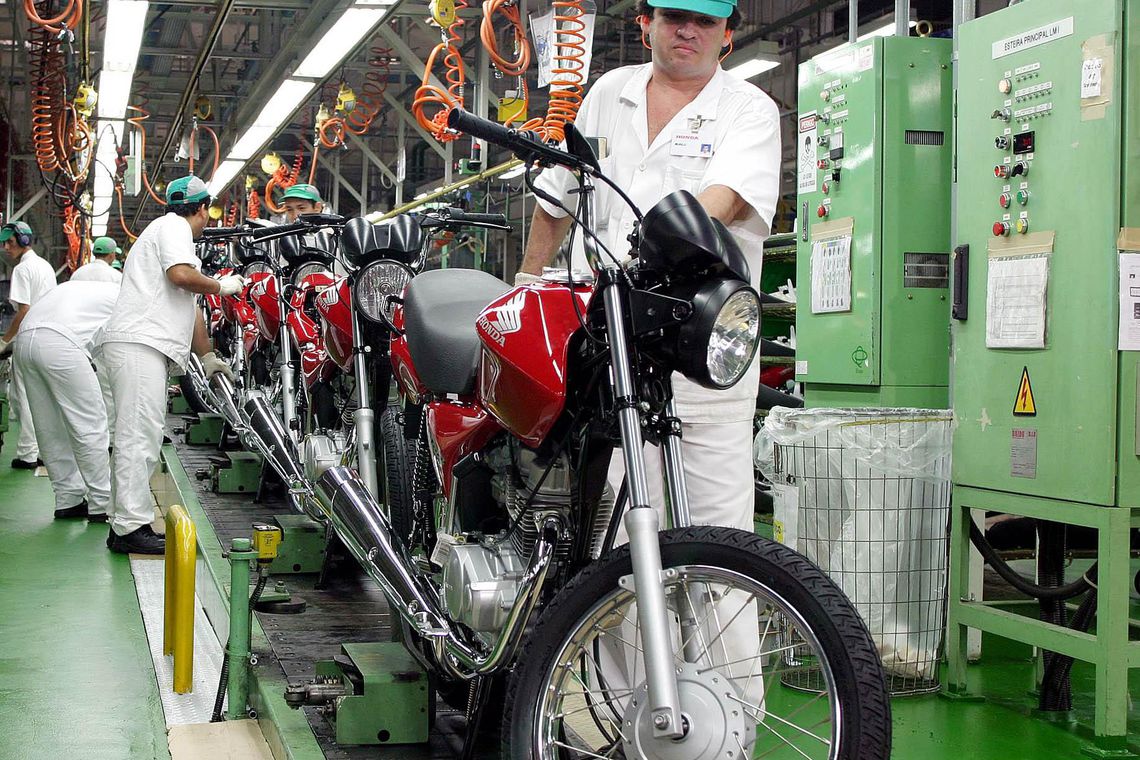
When comparing July to the same month last year, domestic demand for industrial goods advanced 1.2 percent.
RT
Ask Rio Times
Latin American markets, currencies and companies.
Open the full Ask Rio Times →

According to the Institute of Applied Economic Research (IPEA), among the apparent consumption items, while non-exported domestic production grew 1.1 percent in July of this year compared to the previous month, imports of industrial goods were up 8.9 percent over the same period.

The major goods categories, in general, showed growth in relation to the month of June, with prominence for durable consumer goods (3.9 percent) and non-durable (2.6 percent). However, in comparison with July 2018, the decline was widespread, with a negative emphasis on capital goods (-2.9 percent) and durable goods (-3 percent).

According to IPEA, the economic categories’ strong performance in July, in relation to June of this year, was reflected in the production sectors, with an increase of 2.4 percent in domestic demand for manufactured goods in relation to June. Mineral extraction also rose for the third consecutive period, up 13.3 percent. Of the total of 22 sectors, 16 progressed, particularly transport equipment (23.6 percent) and metallurgy (18.3 percent).

The LatAm Brief

One email, every weekday morning. What moved in Latin American markets, politics and expat life.

Yesterday’s subject line: “Colombia's president announces a new cartel airstrike”

When comparing July to the same month last year, domestic demand for industrial goods advanced 1.2 percent. The quarter ended in July showed a 0.4 percent increase in relation to the same period last year. In the 12-month accumulated variation, demand recorded a 1.1 percent drop.

This article was produced by The Rio Times’ automated AI newsroom. Editorial responsibility: Matthias Camenzind, Publisher and Editor-in-Chief. The Rio Times also runs Ask Rio Times, which answers from 100,000+ of our own articles, the daily Latin America Power Map, and prediction-market odds on elections and markets.. How we use AI · Report an error

The Rio Times · Power Map
See who really holds power in Latin America
Click to open the Power Map →

Brazil runoff date: Sunday, October 25, poll closing times and when results start · Brazil runoff polls: Flávio 51%, Lula 49% · Kalshi and Polymarket odds

Rotate for Best Experience

This report is optimized for landscape viewing. Rotate your phone for the full experience.