IBOV 167,874.64 ▼ 2.50% IPSA 11,128.56 ▼ 1.25% IPC MEX 65,878.37 ▼ 0.84% MERVAL 3,022,485 ▼ 3.19% COLCAP 2,423.37 ▲ 2.14% BVL PERÚ 59,693.55 ▼ 1.60% USD/BRL5.16▼ 0.06% USD/MXN17.06▼ 0.20% USD/CLP913.38▼ 0.42% USD/COP3,128▼ 0.38% USD/PEN3.38▼ 0.08% USD/ARS1,491▼ 0.53% USD/UYU40.23▲ 1.56% USD/PYG5,925▲ 1.88% USD/BOB11.72▲ 0.37% USD/DOP58.20▲ 1.20% USD/CRC447.79▲ 1.51% USD/GTQ7.62▲ 2.47% USD/HNL26.78▲ 1.86% USD/NIO36.62▲ 0.69% USD/VES762.44▲ 0.29% USD/PAB1.00— 0.00% USD/BZD2.00— 0.00% USD/JMD157.28▲ 0.32% USD/TTD6.71▲ 1.22% EUR/BRL5.95▲ 1.05% BRENT 89.52 ▲ 2.05% WTI 83.82 ▲ 2.06% IRON ORE 161.91 — — COPPER 6.64 ▲ 0.67% GOLD 4,439 ▲ 1.76% SILVER 64.99 ▼ 0.19% SOY 1,168 ▲ 0.91% CORN 460.75 ▲ 5.13% WHEAT 632.50 ▼ 1.25% COFFEE 312.80 ▼ 5.87% SUGAR 16.74 ▲ 1.64% ORANGE JUICE 139.00 ▼ 2.01% COTTON 83.79 ▲ 1.29% COCOA 5,637 ▼ 3.16% BEEF 226.25 ▼ 3.01% CATTLE 344.98 ▼ 1.65% LITHIUM 74.11 ▼ 0.84% PETR4 41.66 ▼ 1.35% VALE3 74.40 ▲ 2.00% ITUB4 39.00 ▼ 3.51% BBDC4 16.79 ▼ 2.27% ABEV3 15.01 ▼ 1.70% BBAS3 19.28 ▼ 3.74% B3SA3 14.29 ▼ 2.59% WEGE3 47.36 ▼ 0.57% PRIO3 59.25 ▼ 3.25% SUZB3 40.38 ▼ 2.20% RENT3 34.71 ▼ 4.38% AZZA3 16.32 ▼ 2.57% CSAN3 3.28 ▼ 4.93% RAIZ4 0.25 — 0.00% PCAR3 2.76 ▼ 2.82% GMAT3 3.69 ▲ 0.27% PSSA3 48.39 ▼ 2.64% CVCB3 1.37 ▼ 3.52% POSI3 3.28 ▼ 6.29% SLCE3 13.30 ▼ 0.52% NATU3 8.20 ▲ 1.49% BRKM5 5.64 ▼ 1.91% RANI3 7.90 ▼ 1.50% CSNA3 4.28 ▼ 4.04% CMIN3 5.57 ▲ 2.01% USIM5 6.62 ▼ 7.54% GGBR4 24.16 ▼ 4.32% ENEV3 24.55 ▼ 3.04% CPFE3 43.65 ▼ 1.69% CMIG4 10.40 ▼ 2.62% EQTL3 35.81 ▼ 2.61% LREN3 12.03 ▼ 0.74% VIVT3 30.14 ▼ 1.34% RAIL3 12.96 ▼ 1.97% KLABIN 17.55 ▼ 1.74% RAIA DROGASIL 18.28 ▼ 5.68% RDOR3 33.17 ▼ 2.36% HAPV3 9.79 ▼ 4.95% FLRY3 18.59 ▲ 0.93% SMTO3 15.01 ▲ 0.40% UGPA3 30.99 ▼ 0.03% VBBR3 33.23 ▼ 0.63% BBSE3 37.26 ▼ 2.54% BPAC11 50.13 ▼ 6.93% CURY3 31.50 ▼ 0.60% AERI3 2.26 ▼ 2.16% VIVARA 20.89 ▼ 3.47% COMPASS 21.73 ▼ 3.51% VAMOS 2.80 ▼ 3.78% SANB11 29.52 ▲ 0.92% ASAI3 8.08 ▲ 0.25% SBSP3 25.99 ▼ 2.11% WALMEX 48.56 ▲ 0.79% GMEXICO 221.95 ▼ 1.28% FEMSA 201.67 ▼ 1.95% CEMEX 19.16 ▼ 1.64% GFNORTE 191.56 ▼ 2.84% BIMBO 61.64 ▲ 0.08% TELEVISA 9.69 ▼ 2.81% AMX 19.99 ▼ 2.39% GAP 364.14 ▼ 1.66% ASUR 271.64 ▼ 1.09% OMA 232.53 ▲ 0.02% KOF 186.44 ▼ 0.09% GRUMA 251.62 ▼ 1.31% KIMBER 39.51 ▼ 1.96% SQM-B 65,860 ▼ 1.63% COPEC 6,030 ▼ 1.18% BSANTANDER 80.20 ▼ 1.96% FALABELLA 6,429 ▼ 0.16% ENELAM 87.00 ▼ 0.57% CENCOSUD 1,990 ▼ 2.93% CMPC 1,040 ▲ 0.42% BANCO CHILE 186.85 ▼ 1.53% LATAM AIR 24.35 ▼ 1.77% YPF 7,790 ▼ 3.41% GGAL 7,035 ▼ 4.42% PAMPA 5,080 ▼ 3.05% TXAR 765.50 ▲ 1.46% ALUAR 949.50 ▼ 0.21% TGS 8,885 ▼ 4.77% CEPU 2,117 ▼ 3.25% MIRGOR 1,670 ▼ 1.18% COME 41.23 ▼ 0.19% LOMA NEGRA 3,128 ▼ 4.21% BYMA 279.75 — 0.00% TELECOM ARG 4,263 ▼ 5.70% ECOPETROL 17.01 ▼ 0.23% BANCOLOMBIA 98.01 ▲ 7.15% GRUPO AVAL 5.26 ▼ 0.38% CREDICORP 377.21 ▼ 1.31% SOUTHERN COPPER 194.48 ▼ 2.81% BUENAVENTURA 34.84 ▲ 0.75% MERCADOLIBRE 1,940 ▲ 6.34% NUBANK 13.65 ▼ 1.52% XP 15.51 ▼ 4.26% PAGSEGURO 8.89 ▼ 2.09% STONE 9.96 ▼ 3.95% GLOBANT 38.99 ▲ 1.14% TECNOGLASS 42.77 ▲ 3.23% GAP AIRPORT 213.44 ▼ 1.26% ASUR 271.64 ▼ 1.09% OMA AIRPORT 108.40 ▼ 0.12% AMX ADR 23.41 ▼ 2.01% FEMSA ADR 118.13 ▼ 1.49% CEMEX ADR 11.19 ▼ 0.97% PETROBRAS ADR 17.93 ▼ 2.18% VALE ADR 14.32 ▼ 3.83% ITAU ADR 7.50 ▼ 4.82% SANTANDER BR 5.75 ▼ 0.26% AMBEV ADR 2.84 ▼ 3.40% CSN 0.87 ▼ 3.75% GERDAU 4.69 ▼ 5.54% LATAM ADR 53.05 ▼ 1.28% BTC 63,700 ▼ 0.33% ETH 1,882 ▲ 0.59% SOL 76.33 ▲ 0.51% XRP 1.02 ▲ 1.10% BNB 618.93 ▲ 3.38% ADA 0.19 ▼ 2.67% DOGE 0.07 ▲ 3.88% AVAX 6.29 ▼ 2.14% LINK 8.77 ▲ 5.81% DOT 0.79 ▼ 1.48% LTC 45.57 ▲ 1.02% BCH 214.28 ▲ 0.55% TRX 0.33 ▲ 1.26% XLM 0.16 ▲ 0.28% HBAR 0.07 ▼ 1.73% NEAR 1.63 ▲ 1.47% ATOM 1.43 ▲ 2.42% AAVE 88.59 ▼ 0.61% SELIC 14.00% EMBRAER 92.48 ▼ 2.30% EMBRAER ADR 71.39 ▼ 3.27% JBS 13.02 ▼ 2.91% JBS BDR 67.03 ▼ 2.73% MBRF3 16.16 ▲ 1.38% MBRFY 3.06 — 0.00% INTER 5.20 ▼ 2.80% EGX 54,829 ▼ 0.09% USD/ZAR16.18▼ 0.15% USD/NGN 1,360 — 0.00% NIKKEI 67,046 ▲ 0.11% CSI300 4,681 ▲ 0.36% HSI 25,382 ▼ 1.05% NIFTY 24,472 ▼ 0.46% KOSPI 6,563 ▲ 3.42% JCI 6,268 ▼ 1.53% USD/JPY159.33▲ 0.03% USD/CNY6.74▼ 0.01% DAX 26,391 ▲ 0.26% CAC 8,715 ▼ 0.13% FTSE 10,844 ▼ 0.17% MIB 53,706 ▲ 0.08% IBEX 20,214 ▲ 0.20% STOXX 660.51 ▲ 0.01% EUR/USD1.15— 0.00% GBP/USD1.35— 0.00% SPX 7,728 ▼ 0.32% DJI 53,792 ▼ 0.34% NDX 29,525 ▼ 0.33% RUT 3,027 ▲ 0.32% TSX 36,476 ▲ 0.05% VIX 15.28 ▼ 1.16% USD/CAD1.39▲ 0.05% US10Y 4.6840 ▼ 0.32% IBOV 167,874.64 ▼ 2.50% IPSA 11,128.56 ▼ 1.25% IPC MEX 65,878.37 ▼ 0.84% MERVAL 3,022,485 ▼ 3.19% COLCAP 2,423.37 ▲ 2.14% BVL PERÚ 59,693.55 ▼ 1.60% USD/BRL 5.16 ▲ 0.93% USD/MXN 17.06 ▼ 0.44% USD/CLP 913.38 ▼ 0.42% USD/COP 3,128 ▼ 0.87% USD/PEN 3.38 ▼ 0.02% USD/ARS 1,491 ▼ 0.53% USD/UYU 40.23 ▲ 1.56% USD/PYG 5,925 ▲ 1.88% USD/BOB 11.72 ▲ 0.37% USD/DOP 58.20 ▲ 1.20% USD/CRC 447.79 ▲ 1.51% USD/GTQ 7.62 ▲ 2.47% USD/HNL 26.78 ▲ 1.86% USD/NIO 36.62 ▲ 1.01% USD/VES 762.44 ▲ 0.29% USD/PAB 1.00 — 0.00% USD/BZD 2.00 — 0.00% USD/JMD 157.39 ▲ 0.07% USD/TTD 6.71 ▲ 0.81% EUR/BRL 5.95 ▲ 1.42% BRENT 89.52 ▲ 2.05% WTI 83.82 ▲ 2.06% IRON ORE 161.91 — — COPPER 6.64 ▲ 0.67% GOLD 4,439 ▲ 1.76% SILVER 64.99 ▼ 0.19% SOY 1,168 ▲ 0.91% CORN 460.75 ▲ 5.13% WHEAT 632.50 ▼ 1.25% COFFEE 312.80 ▼ 5.87% SUGAR 16.74 ▲ 1.64% ORANGE JUICE 139.00 ▼ 2.01% COTTON 83.79 ▲ 1.29% COCOA 5,637 ▼ 3.16% BEEF 226.25 ▼ 3.01% CATTLE 344.98 ▼ 1.65% LITHIUM 74.11 ▼ 0.84% PETR4 41.66 ▼ 1.35% VALE3 74.40 ▲ 2.00% ITUB4 39.00 ▼ 3.51% BBDC4 16.79 ▼ 2.27% ABEV3 15.01 ▼ 1.70% BBAS3 19.28 ▼ 3.74% B3SA3 14.29 ▼ 2.59% WEGE3 47.36 ▼ 0.57% PRIO3 59.25 ▼ 3.25% SUZB3 40.38 ▼ 2.20% RENT3 34.71 ▼ 4.38% AZZA3 16.32 ▼ 2.57% CSAN3 3.28 ▼ 4.93% RAIZ4 0.25 — 0.00% PCAR3 2.76 ▼ 2.82% GMAT3 3.69 ▲ 0.27% PSSA3 48.39 ▼ 2.64% CVCB3 1.37 ▼ 3.52% POSI3 3.28 ▼ 6.29% SLCE3 13.30 ▼ 0.52% NATU3 8.20 ▲ 1.49% BRKM5 5.64 ▼ 1.91% RANI3 7.90 ▼ 1.50% CSNA3 4.28 ▼ 4.04% CMIN3 5.57 ▲ 2.01% USIM5 6.62 ▼ 7.54% GGBR4 24.16 ▼ 4.32% ENEV3 24.55 ▼ 3.04% CPFE3 43.65 ▼ 1.69% CMIG4 10.40 ▼ 2.62% EQTL3 35.81 ▼ 2.61% LREN3 12.03 ▼ 0.74% VIVT3 30.14 ▼ 1.34% RAIL3 12.96 ▼ 1.97% KLABIN 17.55 ▼ 1.74% RAIA DROGASIL 18.28 ▼ 5.68% RDOR3 33.17 ▼ 2.36% HAPV3 9.79 ▼ 4.95% FLRY3 18.59 ▲ 0.93% SMTO3 15.01 ▲ 0.40% UGPA3 30.99 ▼ 0.03% VBBR3 33.23 ▼ 0.63% BBSE3 37.26 ▼ 2.54% BPAC11 50.13 ▼ 6.93% CURY3 31.50 ▼ 0.60% AERI3 2.26 ▼ 2.16% VIVARA 20.89 ▼ 3.47% COMPASS 21.73 ▼ 3.51% VAMOS 2.80 ▼ 3.78% SANB11 29.52 ▲ 0.92% ASAI3 8.08 ▲ 0.25% SBSP3 25.99 ▼ 2.11% WALMEX 48.56 ▲ 0.79% GMEXICO 221.95 ▼ 1.28% FEMSA 201.67 ▼ 1.95% CEMEX 19.16 ▼ 1.64% GFNORTE 191.56 ▼ 2.84% BIMBO 61.64 ▲ 0.08% TELEVISA 9.69 ▼ 2.81% AMX 19.99 ▼ 2.39% GAP 364.14 ▼ 1.66% ASUR 271.64 ▼ 1.09% OMA 232.53 ▲ 0.02% KOF 186.44 ▼ 0.09% GRUMA 251.62 ▼ 1.31% KIMBER 39.51 ▼ 1.96% SQM-B 65,860 ▼ 1.63% COPEC 6,030 ▼ 1.18% BSANTANDER 80.20 ▼ 1.96% FALABELLA 6,429 ▼ 0.16% ENELAM 87.00 ▼ 0.57% CENCOSUD 1,990 ▼ 2.93% CMPC 1,040 ▲ 0.42% BANCO CHILE 186.85 ▼ 1.53% LATAM AIR 24.35 ▼ 1.77% YPF 7,790 ▼ 3.41% GGAL 7,035 ▼ 4.42% PAMPA 5,080 ▼ 3.05% TXAR 765.50 ▲ 1.46% ALUAR 949.50 ▼ 0.21% TGS 8,885 ▼ 4.77% CEPU 2,117 ▼ 3.25% MIRGOR 1,670 ▼ 1.18% COME 41.23 ▼ 0.19% LOMA NEGRA 3,128 ▼ 4.21% BYMA 279.75 — 0.00% TELECOM ARG 4,263 ▼ 5.70% ECOPETROL 17.01 ▼ 0.23% BANCOLOMBIA 98.01 ▲ 7.15% GRUPO AVAL 5.26 ▼ 0.38% CREDICORP 377.21 ▼ 1.31% SOUTHERN COPPER 194.48 ▼ 2.81% BUENAVENTURA 34.84 ▲ 0.75% MERCADOLIBRE 1,940 ▲ 6.34% NUBANK 13.65 ▼ 1.52% XP 15.51 ▼ 4.26% PAGSEGURO 8.89 ▼ 2.09% STONE 9.96 ▼ 3.95% GLOBANT 38.99 ▲ 1.14% TECNOGLASS 42.77 ▲ 3.23% GAP AIRPORT 213.44 ▼ 1.26% ASUR 271.64 ▼ 1.09% OMA AIRPORT 108.40 ▼ 0.12% AMX ADR 23.41 ▼ 2.01% FEMSA ADR 118.13 ▼ 1.49% CEMEX ADR 11.19 ▼ 0.97% PETROBRAS ADR 17.93 ▼ 2.18% VALE ADR 14.32 ▼ 3.83% ITAU ADR 7.50 ▼ 4.82% SANTANDER BR 5.75 ▼ 0.26% AMBEV ADR 2.84 ▼ 3.40% CSN 0.87 ▼ 3.75% GERDAU 4.69 ▼ 5.54% LATAM ADR 53.05 ▼ 1.28% BTC 63,700 ▼ 0.33% ETH 1,882 ▲ 0.59% SOL 76.33 ▲ 0.51% XRP 1.02 ▲ 1.10% BNB 618.93 ▲ 3.38% ADA 0.19 ▼ 2.67% DOGE 0.07 ▲ 3.88% AVAX 6.29 ▼ 2.14% LINK 8.77 ▲ 5.81% DOT 0.79 ▼ 1.48% LTC 45.57 ▲ 1.02% BCH 214.28 ▲ 0.55% TRX 0.33 ▲ 1.26% XLM 0.16 ▲ 0.28% HBAR 0.07 ▼ 1.73% NEAR 1.63 ▲ 1.47% ATOM 1.43 ▲ 2.42% AAVE 88.59 ▼ 0.61% SELIC 14.00% EMBRAER 92.48 ▼ 2.30% EMBRAER ADR 71.39 ▼ 3.27% JBS 13.02 ▼ 2.91% JBS BDR 67.03 ▼ 2.73% MBRF3 16.16 ▲ 1.38% MBRFY 3.06 — 0.00% INTER 5.20 ▼ 2.80% EGX 54,829 ▼ 0.09% USD/ZAR 16.19 ▼ 0.08% USD/NGN 1,360 — 0.00% NIKKEI 67,046 ▲ 0.11% CSI300 4,681 ▲ 0.36% HSI 25,382 ▼ 1.05% NIFTY 24,472 ▼ 0.46% KOSPI 6,563 ▲ 3.42% JCI 6,268 ▼ 1.53% USD/JPY 159.36 ▲ 0.06% USD/CNY 6.7449 ▲ 0.12% DAX 26,391 ▲ 0.26% CAC 8,715 ▼ 0.13% FTSE 10,844 ▼ 0.17% MIB 53,706 ▲ 0.08% IBEX 20,214 ▲ 0.20% STOXX 660.51 ▲ 0.01% EUR/USD 1.1541 ▼ 0.04% GBP/USD 1.3505 ▲ 0.01% SPX 7,728 ▼ 0.32% DJI 53,792 ▼ 0.34% NDX 29,525 ▼ 0.33% RUT 3,027 ▲ 0.32% TSX 36,476 ▲ 0.05% VIX 15.28 ▼ 1.16% USD/CAD 1.3930 ▲ 0.04% US10Y 4.6840 ▼ 0.32%
since 2009
Wednesday, August 12, 2026

Brazil Business - Brazil

Brazil Income Inequality Worsens as Top 1% Earns 31.5 Times Poorer Half

By · August 12, 2026 · 6 min read

Daily Brief

The morning intel from across Latin America. Free.

By subscribing you agree to our privacy policy. We never share your email.

Brazil · Economy

Key Facts

  • Richest 1% ratio 31.5 times the poorest 50% income in 2025, up from 30.2 in 2024
  • Poverty rate 24.7% of population in 2025, down from 25.4% in 2024
  • People in poverty 52.4 million in 2025, down from 53.8 million in 2024
  • Top 10% to bottom 40% ratio 13.8 in 2025, up from 13.2 in 2024
  • Center-West ratio 13.0 in 2025, up from 11.7 in 2024
  • South lowest ratio 10.0 in 2025
  • Report basis 2026 Relatório do Observatório Brasileiro das Desigualdades, using IBGE/PNAD Contínua data

Poverty fell slightly in 2025, but the richest 1% expanded their income lead, a new report shows.
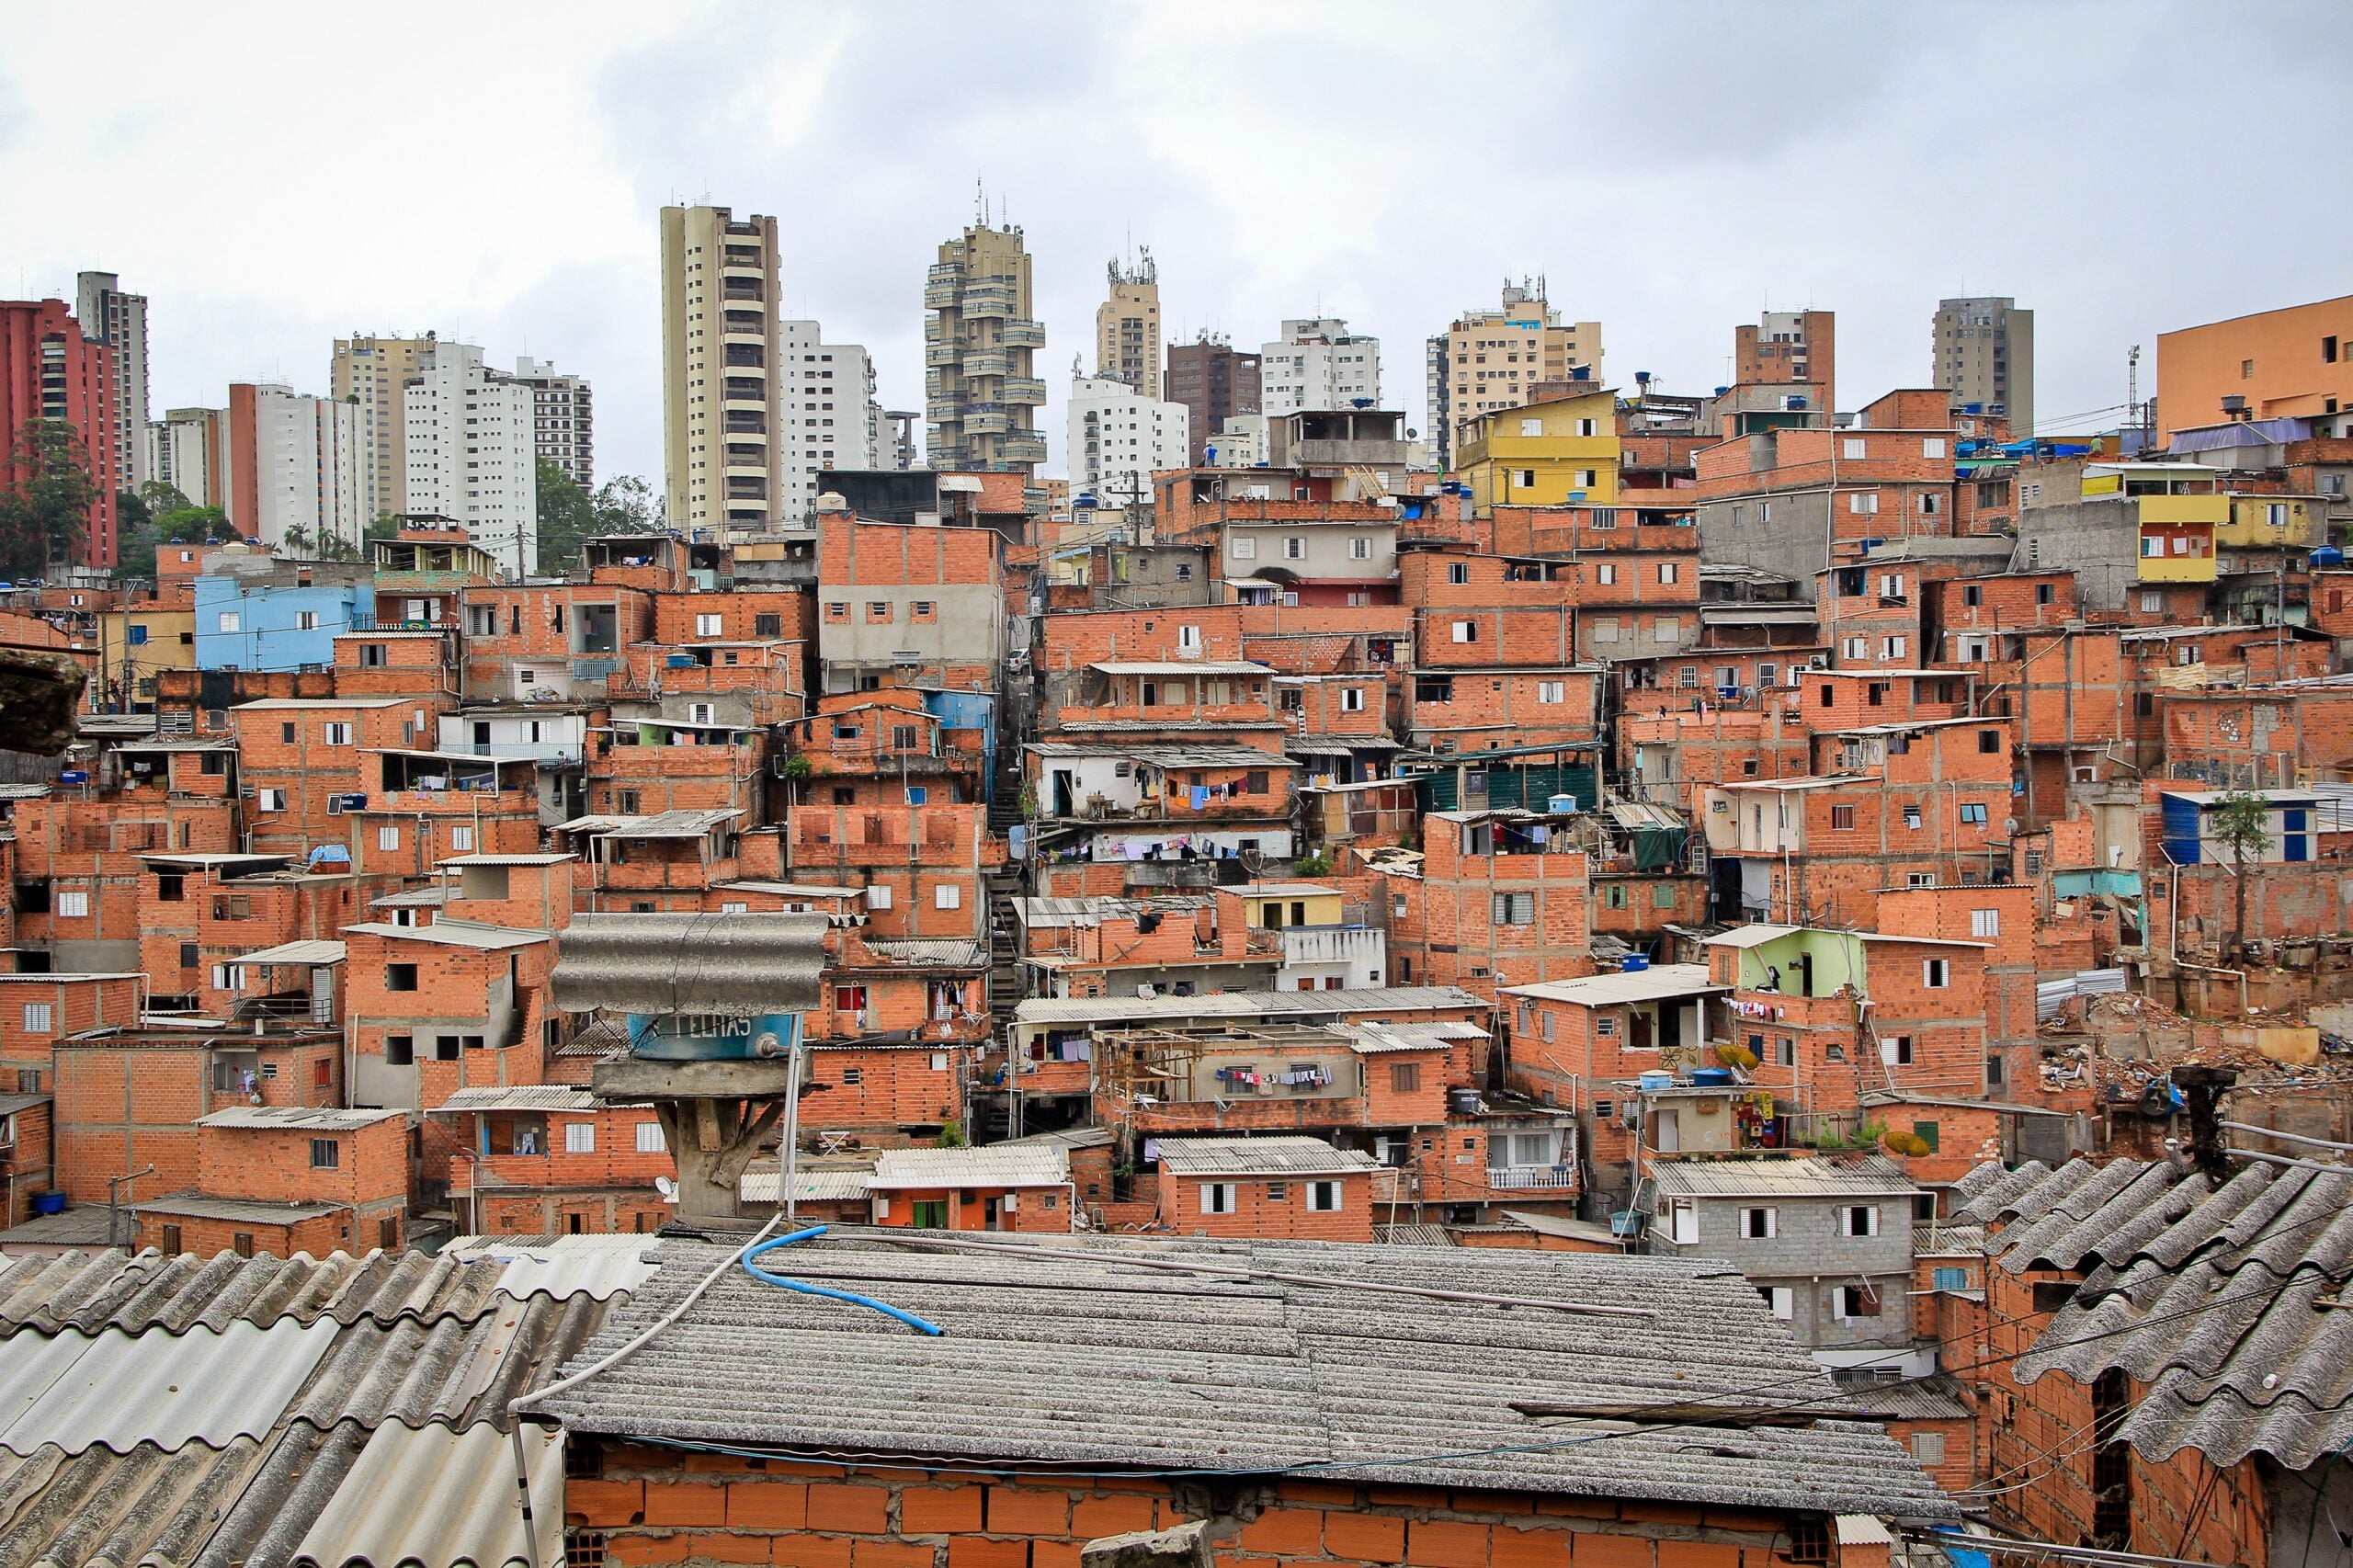
Brazil income inequality chart showing top 1% vs poorest 50%
Homes in Paraisópolis, one of São Paulo’s largest favelas, beside high-rise towers. IBGE data show Brazil’s richest 1% earn about 31.5 times the income of the poorer half. (Photo: Vilar Rodrigo, CC BY-SA 3.0, Wikimedia Commons.)
One-stop reference
Company Intelligence
Every listed company in Latin America — financials, ownership and structure for 1,450+ companies across 26 exchanges, in one place.
Browse the directory →
RT
Ask Rio Times
Latin American markets, currencies and companies.
Open the full Ask Rio Times →

Brazil income inequality worsened in 2025, with the richest 1% earning 31.5 times as much as the poorest half. According to a new report.

The 2026 Relatório do Observatório Brasileiro das Desigualdades, based on IBGE/PNAD Contínua data. Was released Wednesday by the Pacto Nacional pelo Combate às Desigualdades.

income inequality: Report Details

The report, produced by Dieese and launched on 12 Aug. 2026, uses 2025 data from the national continuous household survey.

It shows the average income of the richest 1% was 31.5 times that of the poorest 50%. Up from 30.2 times in 2024.

The ratio between the top 10% and bottom 40% also rose, from 13.2 to 13.8. Regional differences persist, with the Center-West seeing the ratio climb from 11.7 to 13.0, while the South remained the lowest at 10.0.

The report’s authors note that this concentration of income at the very top is a structural feature of the Brazilian economy. Driven by high returns on capital and concentrated wealth.

They emphasize that the growth in the top 1%’s share occurred even as the labor market showed signs of recovery. Dieese, the Departamento Intersindical de Estatística e Estudos Socioeconômicos, is a well-known research body linked to Brazilian trade unions.

Its participation lends the report a degree of methodological rigor and social accountability.

Poverty Declines

Despite increased concentration, the share of people with household per-capita income up to half the minimum wage fell to 24.7% in 2025. Down from 25.4% in 2024.

This corresponds to 52.4 million people, a decrease from 53.8 million the previous year. The decline indicates some progress in absolute terms, even as the income gap widens.

The report attributes the mixed results to ongoing structural factors. The poverty line used in the report is based on half the minimum wage, a common benchmark in Brazil for extreme poverty.

The report focuses on relative shares rather than converting to absolute income figures. The reduction in poverty may be linked to increases in social transfer programs.

Such as the Bolsa Família, which was expanded during the period. However, the report cautions that such gains are fragile and can be reversed.

Context and Interpretation

The IBGE data underlying the report is part of the PNAD Contínua, a continuous national household sample survey. The report is produced by the Pacto Nacional pelo Combate às Desigualdades, a coalition of civil society groups.

Analysts note that income concentration can persist even when poverty falls, reflecting unequal growth. The report’s authors highlight the need for policies targeting the wealthiest segments.

Economists point out that the income gap between the top 1% and the bottom 50% is a persistent feature of many economies. But Brazil’s level is exceptionally high.

Brazil ranks among the most unequal countries in the world. The report’s focus on the top 1% is significant because that group’s income growth often comes from capital gains.

Which are taxed at lower rates than labor income. This has led to calls for progressive taxation on wealth and dividends.

Historical Comparison

The 2025 ratio of 31.5 is higher than the 2024 figure of 30.2, indicating a reversal of a previous trend. In earlier years, some improvements in inequality were recorded, but recent data show a worsening.

The Center-West’s jump from 11.7 to 13.0 is notably sharp, suggesting regional economic dynamics. The South’s stable 10.0 ratio remains the lowest among all regions.

Income inequality in Brazil has been on a long-term decline since the early 2000s. But the pace has slowed and even reversed in some periods.

The latest PNAD data suggest that the reversal is gaining momentum. The report also highlights that the North and Northeast regions, historically poorer.

Have seen less improvement in inequality, with ratios above the national average. This regional disparity underscores the need for targeted policies.

Reaction and Significance

The report’s release has sparked discussions among economists and policymakers. Some experts argue that Brazil income inequality remains a persistent challenge despite poverty reduction.

The data comes ahead of the 2026 elections, where economic policy is a key issue. The report is expected to inform debates on taxation and social spending.

Political leaders from various parties have commented on the findings. With some using them to argue for tax reform that increases taxes on the rich.

Others caution against overly aggressive measures that could harm investment. Civil society groups have organized events to publicize the report, calling for a national dialogue on inequality.

They plan to present the data to the presidential candidates ahead of the elections.

Methodological Notes

The figures are based on 2025 annual data from PNAD Contínua, providing a comprehensive view of income distribution. The report does not specify exact income amounts or US$ equivalents, as the focus is on ratios.

No official IBGE press release was cited directly, but the report is a secondary analysis of IBGE microdata. The Pacto Nacional pelo Combate às Desigualdades has released a full report with detailed tables.

The PNAD Contínua is one of the most complete sources of income data in Brazil. It includes information on all sources of income, including labor, capital, and transfers, making it suitable for inequality analysis.

The report acknowledges limitations, such as the potential underreporting of high incomes, which is common in household surveys. The authors used calibration techniques from national accounts, but actual inequality might be even higher.

Frequently Asked Questions

What does ‘PNAD Contínua’ stand for?

PNAD Contínua is the Brazilian government’s continuous national household sample survey, conducted by IBGE. It collects data on income, employment, and social indicators throughout the year.

Who publishes the Relatório do Observatório Brasileiro das Desigualdades?

The report is produced by the Pacto Nacional pelo Combate às Desigualdades, a coalition including Dieese. It uses IBGE data to analyze income inequality in Brazil.

What is the poverty threshold used in the report?

The poverty measure is the share of people with household per-capita income up to half the minimum wage. In 2025, this was 24.7% of the population, or 52.4 million people.

How does Brazil’s income inequality compare regionally?

The Center-West has the highest inequality ratio between top 10% and bottom 40%. At 13.0, while the South has the lowest at 10.0.

Sources: Poder360, O Globo, IBGE

This article was produced by The Rio Times’ automated newsroom system. How we use AI · Report an error

Read More from The Rio Times

The Rio Times · Power Map
See who really holds power in Latin America
Click to open the Power Map

Rotate for Best Experience

This report is optimized for landscape viewing. Rotate your phone for the full experience.