Northern and Northeastern Brazilian Capitals Lead Rental Price Increases in February
The Brazilian rental market continues to show strong growth in early 2025, with cities in the North and Northeast regions leading the way in price increases.
According to the latest FipeZAP index data, residential rental prices rose by 1.07% in February, accelerating from December (0.93%) and January (0.96%). The 12-month accumulated increase reached 12.92%, significantly outpacing inflation as measured by the IPCA at 5.06% for the same period.
Regional Disparities and Leading Markets
Among the 36 cities monitored by the index, the capitals with the highest monthly increases were:
- Aracaju (SE): +4.42%
- Manaus (AM): +3.49%
- Salvador (BA): +2.82%
- João Pessoa (PB): +2.54%
- Belém (PA): +2.34%
This surge in Northern and Northeastern cities represents a notable shift in Brazil’s real estate market dynamics. Traditionally, the country’s economic powerhouses in the Southeast, particularly São Paulo and Rio de Janeiro, have dominated price growth.
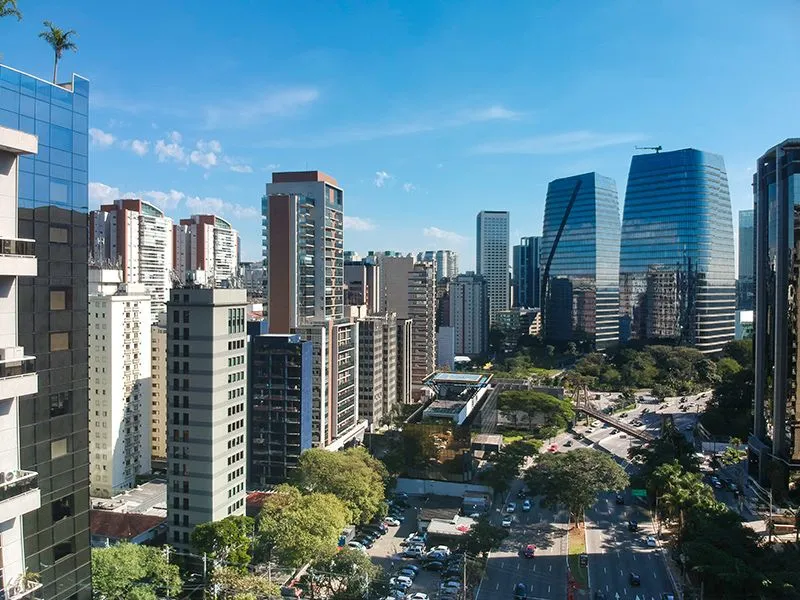
However, emerging markets in the Northeast have been gaining momentum, with cities like Recife and Natal attracting both domestic and international investors.
The FipeZAP Housing Index reached a historic milestone in January 2025, hitting a record 170.50 points—its highest level since tracking began in 2012. This follows a robust 7.73% increase in residential property prices during 2024, marking the strongest annual performance since 2013.
Price Variations by Property Size
The national average rental price stood at R$47.47 per square meter in February. A clear pricing pattern emerged based on property size:
- One-bedroom properties: R$63.54/m² (highest average)
- Two-bedroom properties: R$44.57/m²
- Three-bedroom properties: R$40.56/m² (lowest average)
- Four or more bedrooms: R$43.09/m²
The premium pricing for smaller units reflects a fundamental shift in Brazil’s housing preferences. Market experts attribute this to changing demographics, with young professionals and singles increasingly seeking compact, affordable housing options in urban centers. Investors are also targeting one-bedroom properties for their attractive rental yields.
Capital Cities Price Comparison
Among the 22 capital cities analyzed, São Paulo maintained its position as the most expensive rental market with an average price of R$59.19/m². The top five most expensive capitals were:
1. São Paulo (SP): R$59.19/m²
2. Recife (PE): R$56.67/m²
3. Belém (PA): R$56.62/m²
4. Florianópolis (SC): R$55.64/m²
5. São Luís (MA): R$53.78/m²
Market Trends and Structural Changes
Several factors are driving the current rental market dynamics in Brazil:
Rising Demand for Work-from-Home Spaces: The demand for residential properties with dedicated home office spaces has increased significantly across the country. In cities like Niterói, this demand rose by 30%, highlighting a permanent shift in housing preferences following the pandemic.
Growth in Emerging Markets: Cities in the Northeast, such as João Pessoa, are experiencing substantial growth in new residential developments, projected to increase by 22% by 2025 due to rising demand. This growth is fueled by economic stability, improved infrastructure, and quality of life considerations.
Strong Performance of São Paulo Market: São Paulo’s residential property prices are expected to rise by approximately 15% by 2025 due to high demand and limited supply. In January 2025, rental yields in São Paulo reached 0.509%, continuing an upward trend.
Focus on Smaller Units: The higher prices for one-bedroom apartments reflect a structural change in Brazil’s housing market. As household sizes decrease and more people live alone, the demand for smaller units has intensified, particularly in urban centers.
Challenges and Outlook
Despite the current strength in rental prices, some challenges loom on the horizon. The Brazilian Association of Real Estate Credit expects financing to shrink by 10% in 2025 after two years of growth.
Rising interest rates may cool the market, particularly affecting mortgage accessibility for first-time buyers. However, the continued strength of rental prices, especially in Northern and Northeastern capitals and for one-bedroom properties, suggests underlying structural changes in Brazil’s housing market that may persist despite financing challenges.
The divergence between rental price growth (12.92%) and inflation (5.06%) indicates real growth in housing costs that is reshaping Brazil’s urban landscape and creating new investment opportunities across previously overlooked regions.
More: Brazil news in English, every day from The Rio Times.
Live Market IntelligenceBrazil — Live Market Board
Rio Times · Live Market Intelligence
Brazil — Live Market Board
-0.56%
187,206.89
-0.56%
63,924.77
-0.28%
11,220.60
-0.16%
3,098,898
-1.87%
2,589.69
-1.41%
59,373.28
—
| Instrument | Last | Change | YoY | Prev. | High | Low | Volume |
|---|---|---|---|---|---|---|---|
| IBOV | 187,206.89 | -0.56% | +21.85% | 188,268.59 | 168,310 | 167,142 | — |
| USD/BRL | 5.16 | +0.01% | -5.13% | 5.16 | 5.18 | 5.14 | — |
| SELIC | 14.00% | — | — | — | — | — | |
| PETR4 | 41.64 | -0.05% | +35.19% | 41.66 | 41.97 | 41.15 | 41,499,400 |
| VALE3 | 72.97 | +0.83% | +30.75% | 72.37 | 73.54 | 72.66 | 17,658,000 |
| ITUB4 | 38.60 | -1.03% | +4.57% | 39.00 | 39.34 | 38.39 | 29,487,800 |
| BBDC4 | 16.85 | +0.36% | +3.50% | 16.79 | 16.90 | 16.67 | 19,416,900 |
| BBAS3 | 19.37 | +0.47% | +0.73% | 19.28 | 19.44 | 19.16 | 11,069,200 |
| B3SA3 | 14.26 | -0.21% | +12.73% | 14.29 | 14.47 | 14.11 | 33,037,800 |
| ABEV3 | 14.89 | -0.80% | +21.91% | 15.01 | 15.07 | 14.81 | 16,453,100 |
| WEGE3 | 47.59 | +0.49% | +29.99% | 47.36 | 48.08 | 47.36 | 3,364,600 |
| PRIO3 | 59.14 | -0.19% | +50.67% | 59.25 | 59.81 | 58.74 | 3,325,600 |
| SUZB3 | 41.33 | +2.35% | -23.55% | 40.38 | 41.48 | 40.35 | 3,914,900 |
| RENT3 | 34.68 | -0.09% | +0.84% | 34.71 | 34.96 | 34.35 | 7,979,100 |
| AZZA3 | 15.89 | -2.63% | -53.76% | 16.32 | 16.42 | 15.82 | 1,330,300 |
| CSNA3 | 4.30 | +0.47% | -42.65% | 4.28 | 4.41 | 4.26 | 10,076,100 |
| GGBR4 | 24.69 | +2.19% | +51.38% | 24.16 | 24.85 | 24.18 | 7,047,600 |
| ENEV3 | 24.21 | -1.38% | +70.49% | 24.55 | 24.64 | 23.99 | 9,297,000 |
This article was produced by The Rio Times’ automated newsroom system. How we use AI · Report an error
Read More from The Rio Times