IBOV 182,571.92 ▼ 0.23% IPSA 11,080.24 ▼ 0.51% IPC MEX 64,944.41 ▼ 0.07% MERVAL 2,800,120 ▲ 0.04% COLCAP 2,581.92 ▲ 0.10% BVL PERÚ 60,220.45 ▲ 0.05% USD/BRL5.24▲ 0.19% USD/MXN18.12▲ 0.70% USD/CLP972.55▲ 0.43% USD/COP3,335▲ 0.96% USD/PEN3.44▲ 0.05% USD/ARS1,525▼ 0.03% USD/UYU40.27▲ 3.67% USD/PYG5,843▲ 2.30% USD/BOB11.96▲ 0.45% USD/DOP59.27▲ 2.75% USD/CRC452.68▲ 2.68% USD/GTQ7.64▲ 3.13% USD/HNL26.87▲ 3.23% USD/NIO36.62▲ 2.65% USD/VES855.74▼ 0.13% USD/PAB1.00— 0.00% USD/BZD2.00— 0.00% USD/JMD 157.28 — 0.00% USD/TTD6.70▲ 1.64% EUR/BRL5.92▲ 0.47% BRENT 88.88 ▼ 0.03% WTI 83.11 ▼ 0.11% IRON ORE 161.91 — — COPPER 6.61 ▲ 0.03% GOLD 4,461 ▲ 1.78% SILVER 65.59 ▲ 1.26% SOY 1,184 ▲ 3.20% CORN 480.50 ▲ 10.02% WHEAT 655.00 ▲ 3.93% COFFEE 317.25 ▼ 5.51% SUGAR 16.43 ▼ 1.79% ORANGE JUICE 138.55 ▼ 0.47% COTTON 85.03 ▲ 2.33% COCOA 5,719 ▲ 3.18% BEEF 223.60 ▼ 3.93% CATTLE 339.10 ▼ 3.16% LITHIUM 75.20 ▲ 1.47% PETR4 41.64 ▼ 0.05% VALE3 72.97 ▲ 0.83% ITUB4 38.60 ▼ 1.03% BBDC4 16.85 ▲ 0.36% ABEV3 14.89 ▼ 0.80% BBAS3 19.37 ▲ 0.47% B3SA3 14.26 ▼ 0.21% WEGE3 47.59 ▲ 0.49% PRIO3 59.14 ▼ 0.19% SUZB3 41.33 ▲ 2.35% RENT3 34.68 ▼ 0.09% AZZA3 15.89 ▼ 2.63% CSAN3 3.22 ▼ 1.83% RAIZ4 0.25 — 0.00% PCAR3 2.75 ▼ 0.36% GMAT3 3.65 ▼ 1.08% PSSA3 48.13 ▼ 0.54% CVCB3 1.33 ▼ 2.92% POSI3 3.36 ▲ 2.44% SLCE3 13.34 ▲ 0.30% NATU3 8.14 ▼ 0.73% IBOV 182,571.92 ▼ 0.23% IPSA 11,080.24 ▼ 0.51% IPC MEX 64,944.41 ▼ 0.07% MERVAL 2,800,120 ▲ 0.04% COLCAP 2,581.92 ▲ 0.10% BVL PERÚ 60,220.45 ▲ 0.05% USD/BRL 5.16 ▲ 0.01% USD/MXN 17.06 ▼ 0.24% USD/CLP 913.98 ▲ 0.04% USD/COP 3,140 ▲ 0.03% USD/PEN 3.36 ▼ 0.66% USD/ARS 1,493 ▲ 0.10% USD/UYU 40.27 ▲ 1.24% USD/PYG 5,939 ▲ 1.68% USD/BOB 11.64 ▼ 0.76% USD/DOP 58.34 ▲ 1.25% USD/CRC 445.92 ▲ 0.89% USD/GTQ 7.62 ▲ 2.21% USD/HNL 26.79 ▲ 1.57% USD/NIO 36.62 ▲ 0.69% USD/VES 762.44 ▼ 0.13% USD/PAB 1.00 — 0.00% USD/BZD 2.00 — 0.00% USD/JMD 157.28 — 0.00% USD/TTD 6.70 ▲ 0.61% EUR/BRL 5.95 ▲ 1.01% BRENT 88.88 ▼ 0.03% WTI 83.11 ▼ 0.11% IRON ORE 161.91 — — COPPER 6.61 ▲ 0.03% GOLD 4,461 ▲ 1.78% SILVER 65.59 ▲ 1.26% SOY 1,184 ▲ 3.20% CORN 480.50 ▲ 10.02% WHEAT 655.00 ▲ 3.93% COFFEE 317.25 ▼ 5.51% SUGAR 16.43 ▼ 1.79% ORANGE JUICE 138.55 ▼ 0.47% COTTON 85.03 ▲ 2.33% COCOA 5,719 ▲ 3.18% BEEF 223.60 ▼ 3.93% CATTLE 339.10 ▼ 3.16% LITHIUM 75.20 ▲ 1.47% PETR4 41.64 ▼ 0.05% VALE3 72.97 ▲ 0.83% ITUB4 38.60 ▼ 1.03% BBDC4 16.85 ▲ 0.36% ABEV3 14.89 ▼ 0.80% BBAS3 19.37 ▲ 0.47% B3SA3 14.26 ▼ 0.21% WEGE3 47.59 ▲ 0.49% PRIO3 59.14 ▼ 0.19% SUZB3 41.33 ▲ 2.35% RENT3 34.68 ▼ 0.09% AZZA3 15.89 ▼ 2.63% CSAN3 3.22 ▼ 1.83% RAIZ4 0.25 — 0.00% PCAR3 2.75 ▼ 0.36% GMAT3 3.65 ▼ 1.08% PSSA3 48.13 ▼ 0.54% CVCB3 1.33 ▼ 2.92% POSI3 3.36 ▲ 2.44% SLCE3 13.34 ▲ 0.30% NATU3 8.14 ▼ 0.73%
since 2009
Tuesday, September 29, 2026

São Paulo Life & Society

São Paulo Property Values Soar: Tremembé Leads with 39% Growth in 2024

By · March 12, 2025 · 2 min read

The LatAm Brief

One email, every weekday morning. What moved in Latin American markets, politics and expat life.

Yesterday’s subject line: “Argentina gives Britain two weeks over Falklands oil”

Free. We send a confirmation link first — nothing arrives until you click it. Unsubscribe with one click in any edition. If you stop opening us for 30 days we stop sending by ourselves, as we assume the interest is no longer there. See our privacy policy. We never share your email.

Loft’s recent analysis of São Paulo real estate transactions reveals dramatic price increases across several neighborhoods in January 2025. Property values in Tremembé, Campos Elísios, Itaquera, and Liberdade climbed by approximately 30% compared to January 2024.

Tremembé in the north zone topped the list with a remarkable 39.3% increase. Average property prices there jumped from R$408,300 ($68,050) to R$568,840 ($94,807) within one year.

Campos Elísios in downtown São Paulo followed closely with a 31.9% surge, reaching an average price of R$380,971. Itaquera in the eastern zone secured third place with a 31.8% increase.

Free daily brief — no card needed
Get every Life & Society story in one morning email
We build you a personalized brief around the topics you follow — free for 7 days. Love it? Your first month after that is US$1.

Liberdade completed the top four with a substantial 29.5% growth in property values during the same period. Researchers analyzed 4,100 sales records from the city’s ITBI (Property Transfer Tax) database.

They included only neighborhoods with at least 25 transactions per month to ensure reliable data. “These four regions attract buyers with their solid infrastructure and below-average prices,” explains Fábio Takahashi, Loft’s data manager.
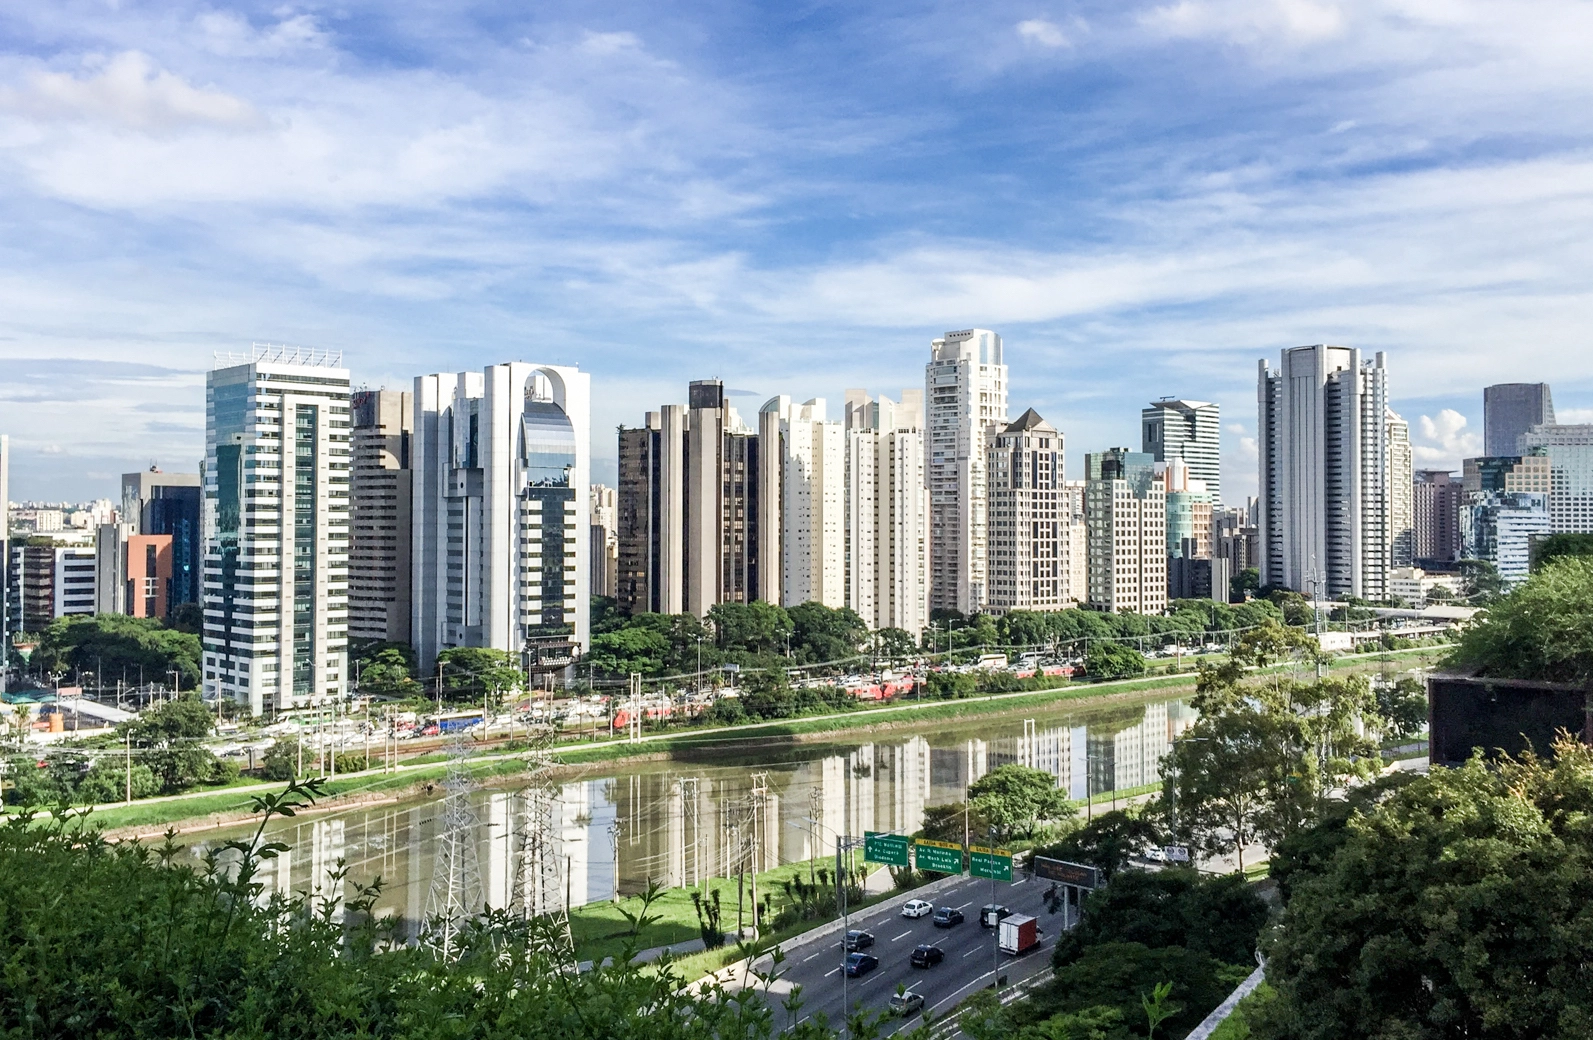
São Paulo Property Values Soar: Tremembé Leads with 39% Growth in 2024
São Paulo Property Values Soar: Tremembé Leads with 39% Growth in 2024.
One-stop reference
Company Intelligence
Every listed company in Latin America — financials, ownership and structure for 1,450+ companies across 26 exchanges, in one place.
Browse the directory →
RT
Ask Rio Times
17 years of Latin America reporting, on demand.
Open the full Ask Rio Times →

The citywide average property price reached R$770,000 ($128,333) in January 2025. The study also identified neighborhoods with the highest average sale prices.

Real Estate Market Shifts in São Paulo

Itaim Bibi leads with properties averaging R$3.6 million ($600,000), representing a 27.2% increase from R$2.8 million ($467,000) last year. Jardim América follows with R$2.4 million ($400,000), while Morumbi ranks third at R$1.59 million ($265,000).

Several upscale areas experienced price decreases. Jardim América saw a 30.9% drop, while Morumbi prices fell by 25.2%. Vila Madalena and Jardim Paulista also declined by 23.5% and 16.6% respectively.

Meanwhile, Tatuapé and Vila Formosa demonstrated strong growth with increases of 29.4% and 29.3%. The prestigious Itaim Bibi neighborhood continued its upward trajectory with a 27.2% price increase.

Real estate experts attribute these shifts to changing buyer preferences and infrastructure developments across the city. Neighborhoods with good amenities and transportation access continue to attract investment despite economic fluctuations.

This article was produced by The Rio Times’ automated newsroom system. How we use AI · Report an error

Read More from The Rio Times

The Rio Times · Power Map
See who really holds power in Latin America
Click to open the Power Map →

Rotate for Best Experience

This report is optimized for landscape viewing. Rotate your phone for the full experience.