IBOV 187,422.92 ▲ 0.44% IPSA 11,426.83 ▲ 0.61% IPC MEX 63,646.88 ▲ 0.17% MERVAL 2,997,659 ▼ 0.04% COLCAP 2,588.64 ▲ 0.90% BVL PERÚ 59,529.36 ▲ 1.84% USD/BRL5.10▲ 0.01% USD/MXN17.32▲ 0.15% USD/CLP943.65▼ 0.59% USD/COP3,203▼ 0.01% USD/PEN3.38▲ 0.10% USD/ARS1,514▼ 0.02% USD/UYU40.06▲ 2.85% USD/PYG5,918▲ 2.61% USD/BOB11.85▲ 25.17% USD/DOP59.17▲ 0.63% USD/CRC445.27▲ 2.73% USD/GTQ7.63▲ 3.12% USD/HNL26.86▲ 3.21% USD/NIO36.62▲ 2.68% USD/VES851.37▼ 0.13% USD/PAB1.00— 0.00% USD/BZD2.00— 0.00% USD/JMD 157.28 — 0.00% USD/TTD6.74▲ 2.27% EUR/BRL5.83▼ 0.41% BRENT 88.88 ▼ 0.03% WTI 83.11 ▼ 0.11% IRON ORE 161.91 — — COPPER 6.61 ▲ 0.03% GOLD 4,461 ▲ 1.78% SILVER 65.59 ▲ 1.26% SOY 1,184 ▲ 3.20% CORN 480.50 ▲ 10.02% WHEAT 655.00 ▲ 3.93% COFFEE 317.25 ▼ 5.51% SUGAR 16.43 ▼ 1.79% ORANGE JUICE 138.55 ▼ 0.47% COTTON 85.03 ▲ 2.33% COCOA 5,719 ▲ 3.18% BEEF 223.60 ▼ 3.93% CATTLE 339.10 ▼ 3.16% LITHIUM 75.20 ▲ 1.47% PETR4 41.64 ▼ 0.05% VALE3 72.97 ▲ 0.83% ITUB4 38.60 ▼ 1.03% BBDC4 16.85 ▲ 0.36% ABEV3 14.89 ▼ 0.80% BBAS3 19.37 ▲ 0.47% B3SA3 14.26 ▼ 0.21% WEGE3 47.59 ▲ 0.49% PRIO3 59.14 ▼ 0.19% SUZB3 41.33 ▲ 2.35% RENT3 34.68 ▼ 0.09% AZZA3 15.89 ▼ 2.63% CSAN3 3.22 ▼ 1.83% RAIZ4 0.25 — 0.00% PCAR3 2.75 ▼ 0.36% GMAT3 3.65 ▼ 1.08% PSSA3 48.13 ▼ 0.54% CVCB3 1.33 ▼ 2.92% POSI3 3.36 ▲ 2.44% SLCE3 13.34 ▲ 0.30% NATU3 8.14 ▼ 0.73% IBOV 187,422.92 ▲ 0.44% IPSA 11,426.83 ▲ 0.61% IPC MEX 63,646.88 ▲ 0.17% MERVAL 2,997,659 ▼ 0.04% COLCAP 2,588.64 ▲ 0.90% BVL PERÚ 59,529.36 ▲ 1.84% USD/BRL 5.16 ▲ 0.01% USD/MXN 17.06 ▼ 0.24% USD/CLP 913.98 ▲ 0.04% USD/COP 3,140 ▲ 0.03% USD/PEN 3.36 ▼ 0.66% USD/ARS 1,493 ▲ 0.10% USD/UYU 40.27 ▲ 1.24% USD/PYG 5,939 ▲ 1.68% USD/BOB 11.64 ▼ 0.76% USD/DOP 58.34 ▲ 1.25% USD/CRC 445.92 ▲ 0.89% USD/GTQ 7.62 ▲ 2.21% USD/HNL 26.79 ▲ 1.57% USD/NIO 36.62 ▲ 0.69% USD/VES 762.44 ▼ 0.13% USD/PAB 1.00 — 0.00% USD/BZD 2.00 — 0.00% USD/JMD 157.28 — 0.00% USD/TTD 6.70 ▲ 0.61% EUR/BRL 5.95 ▲ 1.01% BRENT 88.88 ▼ 0.03% WTI 83.11 ▼ 0.11% IRON ORE 161.91 — — COPPER 6.61 ▲ 0.03% GOLD 4,461 ▲ 1.78% SILVER 65.59 ▲ 1.26% SOY 1,184 ▲ 3.20% CORN 480.50 ▲ 10.02% WHEAT 655.00 ▲ 3.93% COFFEE 317.25 ▼ 5.51% SUGAR 16.43 ▼ 1.79% ORANGE JUICE 138.55 ▼ 0.47% COTTON 85.03 ▲ 2.33% COCOA 5,719 ▲ 3.18% BEEF 223.60 ▼ 3.93% CATTLE 339.10 ▼ 3.16% LITHIUM 75.20 ▲ 1.47% PETR4 41.64 ▼ 0.05% VALE3 72.97 ▲ 0.83% ITUB4 38.60 ▼ 1.03% BBDC4 16.85 ▲ 0.36% ABEV3 14.89 ▼ 0.80% BBAS3 19.37 ▲ 0.47% B3SA3 14.26 ▼ 0.21% WEGE3 47.59 ▲ 0.49% PRIO3 59.14 ▼ 0.19% SUZB3 41.33 ▲ 2.35% RENT3 34.68 ▼ 0.09% AZZA3 15.89 ▼ 2.63% CSAN3 3.22 ▼ 1.83% RAIZ4 0.25 — 0.00% PCAR3 2.75 ▼ 0.36% GMAT3 3.65 ▼ 1.08% PSSA3 48.13 ▼ 0.54% CVCB3 1.33 ▼ 2.92% POSI3 3.36 ▲ 2.44% SLCE3 13.34 ▲ 0.30% NATU3 8.14 ▼ 0.73%
since 2009
Wednesday, September 23, 2026

Mexico’s Industrial Production: A Tale of Growth and Challenges

By · September 12, 2024 · 2 min read

The LatAm Brief

One email, every weekday morning. What moved in Latin American markets, politics and expat life.

Yesterday’s subject line: “68 strikes, 223 people. A UN expert says murder.”

Free. We send a confirmation link first — nothing arrives until you click it. Unsubscribe with one click in any edition. If you stop opening us for 30 days we stop sending by ourselves, as we assume the interest is no longer there. See our privacy policy. We never share your email.

In July, Mexico’s industrial production grew by 2.1% compared to the previous year. This growth reflects the country’s economic resilience amidst global uncertainties. However, the story is more complex than a single percentage.

The construction sector led the charge with a remarkable 5.3% increase. This surge indicates a booming real estate market and infrastructure development.

Meanwhile, energy production and distribution saw a 2.6% rise, highlighting improvements in Mexico’s power grid.

Manufacturing, a crucial component of Mexico‘s economy, experienced a modest 1.6% growth. This sector’s performance often mirrors global trade patterns and domestic consumption trends.

However, the mining sector faced a slight decline of 0.4%. Looking at the broader picture, the first seven months of 2024 showed a 1.5% overall increase in industrial production.
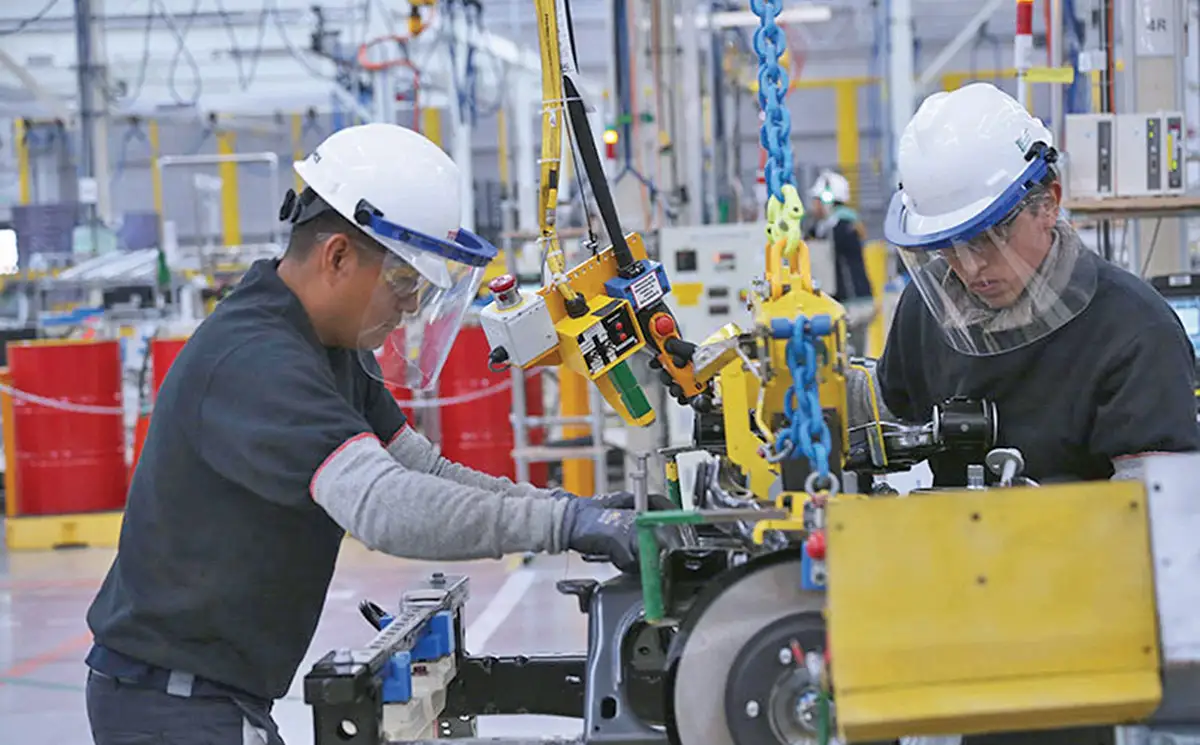
Mexico's Industrial Production: A Tale of Growth and Challenges
Mexico’s Industrial Production: A Tale of Growth and Challenges.
One-stop reference
Company Intelligence
Every listed company in Latin America — financials, ownership and structure for 1,450+ companies across 26 exchanges, in one place.
Browse the directory →
RT
Ask Rio Times
17 years of Latin America reporting, on demand.
Open the full Ask Rio Times →

Construction continued its strong performance with a 9.3% growth during this period. Energy production maintained its upward trajectory.

Interestingly, manufacturing remained stagnant over these seven months. This plateau suggests potential challenges in the sector, possibly due to global supply chain issues or market fluctuations.

Mexico’s Economic Landscape

The mining sector’s 2.4% contraction raises concerns about resource extraction and commodity prices.

Monthly data reveals subtle shifts in the industrial landscape. July saw a 0.2% increase in the Monthly Indicator of Industrial Activity compared to June.

Mining and construction showed positive momentum, while energy and manufacturing experienced slight dips. These figures provide insight into Mexico’s economic trajectory.

The country’s GDP grew by 2.1% year over year in the second quarter of 2024, accumulating a 1.8% increase for the year.

This growth builds on the 3.5% annual increase in industrial production seen in 2023. Mexico’s recent economic performance continues a trend of steady growth.

In 2022, the country’s GDP rose by 3.9%, following a robust 6.1% increase in 2021. The government remains optimistic, projecting at least 3% growth for 2024.

This data paints a picture of an economy in transition. While some sectors thrive, others face challenges.

Mexico’s industrial landscape reflects both domestic policies and global economic forces, shaping the nation’s economic future.

This article was produced by The Rio Times’ automated newsroom system. How we use AI · Report an error

Read More from The Rio Times

The Rio Times · Power Map
See who really holds power in Latin America
Click to open the Power Map

Rotate for Best Experience

This report is optimized for landscape viewing. Rotate your phone for the full experience.