IBOV 187,422.92 ▲ 0.44% IPSA 11,426.83 ▲ 0.61% IPC MEX 63,646.88 ▲ 0.17% MERVAL 2,997,659 ▼ 0.04% COLCAP 2,588.64 ▲ 0.90% BVL PERÚ 59,529.36 ▲ 1.84% USD/BRL5.10▼ 0.16% USD/MXN17.30▲ 0.45% USD/CLP943.65▼ 0.59% USD/COP3,203▲ 0.85% USD/PEN3.38▲ 0.04% USD/ARS1,514▼ 0.02% USD/UYU40.06▲ 2.88% USD/PYG5,918▲ 3.14% USD/BOB11.85▲ 25.24% USD/DOP59.17▲ 3.53% USD/CRC445.27▲ 2.84% USD/GTQ7.63▲ 3.24% USD/HNL26.86▲ 3.32% USD/NIO36.62▲ 2.80% USD/VES850.29▼ 0.13% USD/PAB1.00— 0.00% USD/BZD2.00— 0.00% USD/JMD 157.28 — 0.00% USD/TTD6.74▲ 2.48% EUR/BRL5.85▼ 0.87% BRENT 88.88 ▼ 0.03% WTI 83.11 ▼ 0.11% IRON ORE 161.91 — — COPPER 6.61 ▲ 0.03% GOLD 4,461 ▲ 1.78% SILVER 65.59 ▲ 1.26% SOY 1,184 ▲ 3.20% CORN 480.50 ▲ 10.02% WHEAT 655.00 ▲ 3.93% COFFEE 317.25 ▼ 5.51% SUGAR 16.43 ▼ 1.79% ORANGE JUICE 138.55 ▼ 0.47% COTTON 85.03 ▲ 2.33% COCOA 5,719 ▲ 3.18% BEEF 223.60 ▼ 3.93% CATTLE 339.10 ▼ 3.16% LITHIUM 75.20 ▲ 1.47% PETR4 41.64 ▼ 0.05% VALE3 72.97 ▲ 0.83% ITUB4 38.60 ▼ 1.03% BBDC4 16.85 ▲ 0.36% ABEV3 14.89 ▼ 0.80% BBAS3 19.37 ▲ 0.47% B3SA3 14.26 ▼ 0.21% WEGE3 47.59 ▲ 0.49% PRIO3 59.14 ▼ 0.19% SUZB3 41.33 ▲ 2.35% RENT3 34.68 ▼ 0.09% AZZA3 15.89 ▼ 2.63% CSAN3 3.22 ▼ 1.83% RAIZ4 0.25 — 0.00% PCAR3 2.75 ▼ 0.36% GMAT3 3.65 ▼ 1.08% PSSA3 48.13 ▼ 0.54% CVCB3 1.33 ▼ 2.92% POSI3 3.36 ▲ 2.44% SLCE3 13.34 ▲ 0.30% NATU3 8.14 ▼ 0.73% IBOV 187,422.92 ▲ 0.44% IPSA 11,426.83 ▲ 0.61% IPC MEX 63,646.88 ▲ 0.17% MERVAL 2,997,659 ▼ 0.04% COLCAP 2,588.64 ▲ 0.90% BVL PERÚ 59,529.36 ▲ 1.84% USD/BRL 5.16 ▲ 0.01% USD/MXN 17.06 ▼ 0.24% USD/CLP 913.98 ▲ 0.04% USD/COP 3,140 ▲ 0.03% USD/PEN 3.36 ▼ 0.66% USD/ARS 1,493 ▲ 0.10% USD/UYU 40.27 ▲ 1.24% USD/PYG 5,939 ▲ 1.68% USD/BOB 11.64 ▼ 0.76% USD/DOP 58.34 ▲ 1.25% USD/CRC 445.92 ▲ 0.89% USD/GTQ 7.62 ▲ 2.21% USD/HNL 26.79 ▲ 1.57% USD/NIO 36.62 ▲ 0.69% USD/VES 762.44 ▼ 0.13% USD/PAB 1.00 — 0.00% USD/BZD 2.00 — 0.00% USD/JMD 157.28 — 0.00% USD/TTD 6.70 ▲ 0.61% EUR/BRL 5.95 ▲ 1.01% BRENT 88.88 ▼ 0.03% WTI 83.11 ▼ 0.11% IRON ORE 161.91 — — COPPER 6.61 ▲ 0.03% GOLD 4,461 ▲ 1.78% SILVER 65.59 ▲ 1.26% SOY 1,184 ▲ 3.20% CORN 480.50 ▲ 10.02% WHEAT 655.00 ▲ 3.93% COFFEE 317.25 ▼ 5.51% SUGAR 16.43 ▼ 1.79% ORANGE JUICE 138.55 ▼ 0.47% COTTON 85.03 ▲ 2.33% COCOA 5,719 ▲ 3.18% BEEF 223.60 ▼ 3.93% CATTLE 339.10 ▼ 3.16% LITHIUM 75.20 ▲ 1.47% PETR4 41.64 ▼ 0.05% VALE3 72.97 ▲ 0.83% ITUB4 38.60 ▼ 1.03% BBDC4 16.85 ▲ 0.36% ABEV3 14.89 ▼ 0.80% BBAS3 19.37 ▲ 0.47% B3SA3 14.26 ▼ 0.21% WEGE3 47.59 ▲ 0.49% PRIO3 59.14 ▼ 0.19% SUZB3 41.33 ▲ 2.35% RENT3 34.68 ▼ 0.09% AZZA3 15.89 ▼ 2.63% CSAN3 3.22 ▼ 1.83% RAIZ4 0.25 — 0.00% PCAR3 2.75 ▼ 0.36% GMAT3 3.65 ▼ 1.08% PSSA3 48.13 ▼ 0.54% CVCB3 1.33 ▼ 2.92% POSI3 3.36 ▲ 2.44% SLCE3 13.34 ▲ 0.30% NATU3 8.14 ▼ 0.73%
since 2009
Wednesday, September 23, 2026

Mexican Exports to U.S. Hit Record 15.7% Market Share

By · October 8, 2024 · 2 min read

The LatAm Brief

One email, every weekday morning. What moved in Latin American markets, politics and expat life.

Yesterday’s subject line: “68 strikes, 223 people. A UN expert says murder.”

Free. We send a confirmation link first — nothing arrives until you click it. Unsubscribe with one click in any edition. If you stop opening us for 30 days we stop sending by ourselves, as we assume the interest is no longer there. See our privacy policy. We never share your email.

Mexico has achieved a remarkable milestone in its trade relationship with the United States. Recent data from the US Census Bureau reveals a significant shift in import patterns.

Mexico now stands as the leading external supplier to the US market, surpassing both China and Canada. The figures paint a clear picture of Mexico’s growing influence.

From January to August 2024, Mexico contributed 15.7% of all US imports. This represents a two percentage point increase compared to the same period last year.

The trend has been steadily climbing over the past decade. In contrast, China and Canada have seen their market shares decline.

China’s portion dropped from 13.5% to 13.1%, while Canada’s fell from 13.6% to 12.9%. This shift highlights Mexico’s strengthening position in the US market.
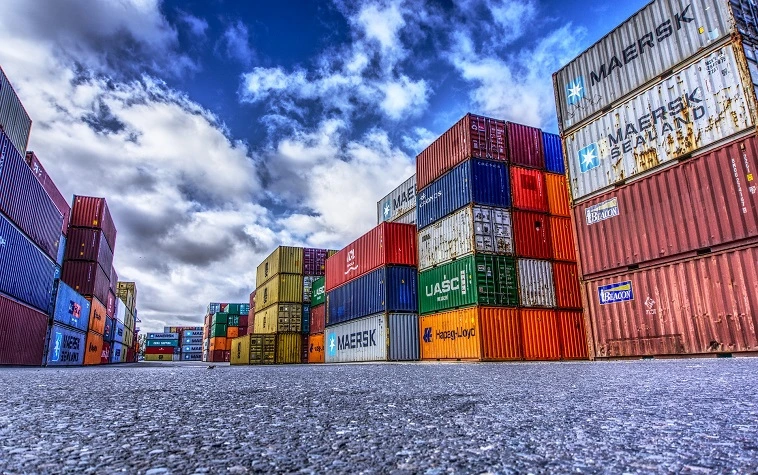
Mexican Exports to U.S. Hit Record 15.7% Market Share
Mexican Exports to U.S. Hit Record 15.7% Market Share.
One-stop reference
Company Intelligence
Every listed company in Latin America — financials, ownership and structure for 1,450+ companies across 26 exchanges, in one place.
Browse the directory →
RT
Ask Rio Times
Latin American markets, currencies and companies.
Open the full Ask Rio Times →

Marcelo Ebrard, Mexico’s Secretary of Economy, expressed optimism about these developments. He noted that Mexico’s market share has tripled since 1988, rising from 5% to nearly 16%.

Ebrard sees great potential for further growth in exports to the United States. August 2024 saw Mexican exports to the US grow by 12.5%, reaching $42,748 million.

This outpaced both Canada and China. Canada’s exports to the US decreased slightly, while China’s grew at a slower rate than Mexico’s.

Mexico’s Ascendancy in Trade with the US

Mexico has become the top exporter of manufactured goods to the US. Meanwhile, the US primarily exports basic grains to Mexico. This trade dynamic underscores the complementary nature of the two economies.

The Mexican government plans to focus on increasing the added value of its exports. This metric has remained relatively stable since the early 2000s.

Efforts will be made to strengthen national content and add value to the production chain. From January to August 2024, Mexican exports to the US increased by 5.8%.

This growth outpaced both China and Canada. Mexico is also approaching the status of being the top destination for US merchandise exports globally. These developments signal a new chapter in North American trade relations.

Mexico’s rising prominence as a trade partner reflects changing global supply chains and regional economic integration. The coming years may see further shifts in this dynamic trade landscape.

This article was produced by The Rio Times’ automated newsroom system. How we use AI · Report an error

Read More from The Rio Times

The Rio Times · Power Map
See who really holds power in Latin America
Click to open the Power Map

Rotate for Best Experience

This report is optimized for landscape viewing. Rotate your phone for the full experience.