IBOV 180,230.99 ▲ 1.59% IPSA 11,315.26 ▼ 1.14% IPC MEX 65,314.78 ▼ 0.18% MERVAL 3,070,880 ▲ 1.22% COLCAP 2,467.03 ▲ 1.73% BVL PERÚ 59,450.29 ▲ 0.04% USD/BRL5.14▼ 0.83% USD/MXN16.99▼ 0.01% USD/CLP936.06▲ 0.19% USD/COP3,165▼ 1.15% USD/PEN3.36▼ 0.16% USD/ARS1,513▲ 0.25% USD/UYU40.24▲ 0.68% USD/PYG5,873▲ 0.47% USD/BOB12.08▲ 3.98% USD/DOP58.56▲ 0.38% USD/CRC446.47▲ 1.09% USD/GTQ7.62▲ 1.63% USD/HNL26.84▲ 1.11% USD/NIO36.62▲ 0.14% USD/VES796.33▼ 0.13% USD/PAB1.00— 0.00% USD/BZD2.00— 0.00% USD/JMD 157.28 — 0.00% USD/TTD6.69▼ 0.06% EUR/BRL5.96▼ 0.90% BRENT 88.88 ▼ 0.03% WTI 83.11 ▼ 0.11% IRON ORE 161.91 — — COPPER 6.61 ▲ 0.03% GOLD 4,461 ▲ 1.78% SILVER 65.59 ▲ 1.26% SOY 1,184 ▲ 3.20% CORN 480.50 ▲ 10.02% WHEAT 655.00 ▲ 3.93% COFFEE 317.25 ▼ 5.51% SUGAR 16.43 ▼ 1.79% ORANGE JUICE 138.55 ▼ 0.47% COTTON 85.03 ▲ 2.33% COCOA 5,719 ▲ 3.18% BEEF 223.60 ▼ 3.93% CATTLE 339.10 ▼ 3.16% LITHIUM 75.20 ▲ 1.47% PETR4 41.64 ▼ 0.05% VALE3 72.97 ▲ 0.83% ITUB4 38.60 ▼ 1.03% BBDC4 16.85 ▲ 0.36% ABEV3 14.89 ▼ 0.80% BBAS3 19.37 ▲ 0.47% B3SA3 14.26 ▼ 0.21% WEGE3 47.59 ▲ 0.49% PRIO3 59.14 ▼ 0.19% SUZB3 41.33 ▲ 2.35% RENT3 34.68 ▼ 0.09% AZZA3 15.89 ▼ 2.63% CSAN3 3.22 ▼ 1.83% RAIZ4 0.25 — 0.00% PCAR3 2.75 ▼ 0.36% GMAT3 3.65 ▼ 1.08% PSSA3 48.13 ▼ 0.54% CVCB3 1.33 ▼ 2.92% POSI3 3.36 ▲ 2.44% SLCE3 13.34 ▲ 0.30% NATU3 8.14 ▼ 0.73% IBOV 180,230.99 ▲ 1.59% IPSA 11,315.26 ▼ 1.14% IPC MEX 65,314.78 ▼ 0.18% MERVAL 3,070,880 ▲ 1.22% COLCAP 2,467.03 ▲ 1.73% BVL PERÚ 59,450.29 ▲ 0.04% USD/BRL 5.16 ▲ 0.01% USD/MXN 17.06 ▼ 0.24% USD/CLP 913.98 ▲ 0.04% USD/COP 3,140 ▲ 0.03% USD/PEN 3.36 ▼ 0.66% USD/ARS 1,493 ▲ 0.10% USD/UYU 40.27 ▲ 1.24% USD/PYG 5,939 ▲ 1.68% USD/BOB 11.64 ▼ 0.76% USD/DOP 58.34 ▲ 1.25% USD/CRC 445.92 ▲ 0.89% USD/GTQ 7.62 ▲ 2.21% USD/HNL 26.79 ▲ 1.57% USD/NIO 36.62 ▲ 0.69% USD/VES 762.44 ▼ 0.13% USD/PAB 1.00 — 0.00% USD/BZD 2.00 — 0.00% USD/JMD 157.28 — 0.00% USD/TTD 6.70 ▲ 0.61% EUR/BRL 5.95 ▲ 1.01% BRENT 88.88 ▼ 0.03% WTI 83.11 ▼ 0.11% IRON ORE 161.91 — — COPPER 6.61 ▲ 0.03% GOLD 4,461 ▲ 1.78% SILVER 65.59 ▲ 1.26% SOY 1,184 ▲ 3.20% CORN 480.50 ▲ 10.02% WHEAT 655.00 ▲ 3.93% COFFEE 317.25 ▼ 5.51% SUGAR 16.43 ▼ 1.79% ORANGE JUICE 138.55 ▼ 0.47% COTTON 85.03 ▲ 2.33% COCOA 5,719 ▲ 3.18% BEEF 223.60 ▼ 3.93% CATTLE 339.10 ▼ 3.16% LITHIUM 75.20 ▲ 1.47% PETR4 41.64 ▼ 0.05% VALE3 72.97 ▲ 0.83% ITUB4 38.60 ▼ 1.03% BBDC4 16.85 ▲ 0.36% ABEV3 14.89 ▼ 0.80% BBAS3 19.37 ▲ 0.47% B3SA3 14.26 ▼ 0.21% WEGE3 47.59 ▲ 0.49% PRIO3 59.14 ▼ 0.19% SUZB3 41.33 ▲ 2.35% RENT3 34.68 ▼ 0.09% AZZA3 15.89 ▼ 2.63% CSAN3 3.22 ▼ 1.83% RAIZ4 0.25 — 0.00% PCAR3 2.75 ▼ 0.36% GMAT3 3.65 ▼ 1.08% PSSA3 48.13 ▼ 0.54% CVCB3 1.33 ▼ 2.92% POSI3 3.36 ▲ 2.44% SLCE3 13.34 ▲ 0.30% NATU3 8.14 ▼ 0.73%
since 2009
Tuesday, September 1, 2026

Mexico North America

Record Exports but Shrinking Market Share: The Dynamics of U.S.-Mexico Trade

By · September 5, 2024 · 2 min read

Daily Brief

The morning intel from across Latin America. Free.

By subscribing you agree to our privacy policy. We never share your email.

In July, Mexico’s exports to the U.S. reached a historic high of $41.94 billion, an increase of 7.8%. This growth marked the fifth consecutive month of gains, improving from June’s 2.8% increase.

The U.S. Census Bureau released these figures. Despite these gains, Mexico’s share of the U.S. import market fell to 14.6%, the lowest since January 2023.

Meanwhile, China’s market share rose from 12.8% to 14.2%, showing a significant recovery. In July, Chinese exports to the U.S. amounted to $40.837 billion. This figure was only $1.104 billion less than Mexico’s exports.

This shift in market shares is particularly striking given the background of the U.S.-China trade war. Prior to the conflict, which began in 2017, China had a 21% share of US imports.

Despite these shifts, the broader trade patterns tell an important story. U.S. exports to Mexico grew 8.7% in July, reaching $28.716 billion.
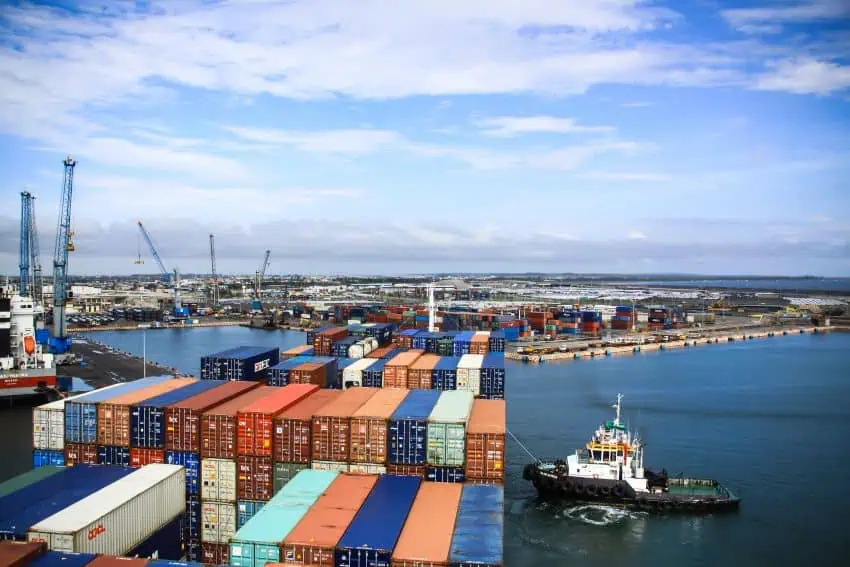
Record Exports but Shrinking Market Share: The Dynamics of U.S.-Mexico Trade
Record Exports but Shrinking Market Share: The Dynamics of U.S.-Mexico Trade. (Photo Internet reproduction)
One-stop reference
Company Intelligence
Every listed company in Latin America — financials, ownership and structure for 1,450+ companies across 26 exchanges, in one place.
Browse the directory →
RT
Ask Rio Times
Latin American markets, currencies and companies.
Open the full Ask Rio Times →

This increase led to a record trade surplus for Mexico of $13.224 billion, a 5.8% rise from the previous year.

This performance confirms Mexico‘s status as the U.S.’s largest trading partner, with total trade reaching $70.657 billion in July alone, up 8.2% year-over-year.

Following Mexico, Canada and China are significant players. Trade between Canada and the U.S. increased by 2.7% to $63.499 billion.

Trade with China grew 10% to $51.549 billion. From January to July, Mexico’s exports to the U.S. grew 5.8%, totaling $290.981 billion.

These numbers not only illustrate the competitive nature of international trade but also highlight the importance of strong trade relationships in fostering economic stability and growth.

As global economic conditions shift, understanding these trade dynamics becomes vital for policymakers and businesses navigating international markets.

Key Facts

Deep Dive

For the complete picture, read our in-depth guide: Mexico Economy 2026: GDP, Peso, Nearshoring, Banxico and Trade

This article was produced by The Rio Times’ automated newsroom system. How we use AI · Report an error

Read More from The Rio Times

The Rio Times · Power Map
See who really holds power in Latin America
Click to open the Power Map

Rotate for Best Experience

This report is optimized for landscape viewing. Rotate your phone for the full experience.