IBOV 187,422.92 ▲ 0.44% IPSA 11,426.83 ▲ 0.61% IPC MEX 63,646.88 ▲ 0.17% MERVAL 2,997,659 ▼ 0.04% COLCAP 2,588.64 ▲ 0.90% BVL PERÚ 59,529.36 ▲ 1.84% USD/BRL5.10▼ 0.16% USD/MXN17.29▲ 0.42% USD/CLP943.65▼ 0.59% USD/COP3,203▲ 0.85% USD/PEN3.38▲ 0.04% USD/ARS1,514▼ 0.02% USD/UYU40.06▲ 2.88% USD/PYG5,918▲ 3.14% USD/BOB11.85▲ 25.24% USD/DOP59.17▲ 3.53% USD/CRC445.27▲ 2.84% USD/GTQ7.63▲ 3.24% USD/HNL26.86▲ 3.32% USD/NIO36.62▲ 2.80% USD/VES850.29▼ 0.13% USD/PAB1.00— 0.00% USD/BZD2.00— 0.00% USD/JMD 157.28 — 0.00% USD/TTD6.74▲ 2.48% EUR/BRL5.85▼ 0.87% BRENT 88.88 ▼ 0.03% WTI 83.11 ▼ 0.11% IRON ORE 161.91 — — COPPER 6.61 ▲ 0.03% GOLD 4,461 ▲ 1.78% SILVER 65.59 ▲ 1.26% SOY 1,184 ▲ 3.20% CORN 480.50 ▲ 10.02% WHEAT 655.00 ▲ 3.93% COFFEE 317.25 ▼ 5.51% SUGAR 16.43 ▼ 1.79% ORANGE JUICE 138.55 ▼ 0.47% COTTON 85.03 ▲ 2.33% COCOA 5,719 ▲ 3.18% BEEF 223.60 ▼ 3.93% CATTLE 339.10 ▼ 3.16% LITHIUM 75.20 ▲ 1.47% PETR4 41.64 ▼ 0.05% VALE3 72.97 ▲ 0.83% ITUB4 38.60 ▼ 1.03% BBDC4 16.85 ▲ 0.36% ABEV3 14.89 ▼ 0.80% BBAS3 19.37 ▲ 0.47% B3SA3 14.26 ▼ 0.21% WEGE3 47.59 ▲ 0.49% PRIO3 59.14 ▼ 0.19% SUZB3 41.33 ▲ 2.35% RENT3 34.68 ▼ 0.09% AZZA3 15.89 ▼ 2.63% CSAN3 3.22 ▼ 1.83% RAIZ4 0.25 — 0.00% PCAR3 2.75 ▼ 0.36% GMAT3 3.65 ▼ 1.08% PSSA3 48.13 ▼ 0.54% CVCB3 1.33 ▼ 2.92% POSI3 3.36 ▲ 2.44% SLCE3 13.34 ▲ 0.30% NATU3 8.14 ▼ 0.73% IBOV 187,422.92 ▲ 0.44% IPSA 11,426.83 ▲ 0.61% IPC MEX 63,646.88 ▲ 0.17% MERVAL 2,997,659 ▼ 0.04% COLCAP 2,588.64 ▲ 0.90% BVL PERÚ 59,529.36 ▲ 1.84% USD/BRL 5.16 ▲ 0.01% USD/MXN 17.06 ▼ 0.24% USD/CLP 913.98 ▲ 0.04% USD/COP 3,140 ▲ 0.03% USD/PEN 3.36 ▼ 0.66% USD/ARS 1,493 ▲ 0.10% USD/UYU 40.27 ▲ 1.24% USD/PYG 5,939 ▲ 1.68% USD/BOB 11.64 ▼ 0.76% USD/DOP 58.34 ▲ 1.25% USD/CRC 445.92 ▲ 0.89% USD/GTQ 7.62 ▲ 2.21% USD/HNL 26.79 ▲ 1.57% USD/NIO 36.62 ▲ 0.69% USD/VES 762.44 ▼ 0.13% USD/PAB 1.00 — 0.00% USD/BZD 2.00 — 0.00% USD/JMD 157.28 — 0.00% USD/TTD 6.70 ▲ 0.61% EUR/BRL 5.95 ▲ 1.01% BRENT 88.88 ▼ 0.03% WTI 83.11 ▼ 0.11% IRON ORE 161.91 — — COPPER 6.61 ▲ 0.03% GOLD 4,461 ▲ 1.78% SILVER 65.59 ▲ 1.26% SOY 1,184 ▲ 3.20% CORN 480.50 ▲ 10.02% WHEAT 655.00 ▲ 3.93% COFFEE 317.25 ▼ 5.51% SUGAR 16.43 ▼ 1.79% ORANGE JUICE 138.55 ▼ 0.47% COTTON 85.03 ▲ 2.33% COCOA 5,719 ▲ 3.18% BEEF 223.60 ▼ 3.93% CATTLE 339.10 ▼ 3.16% LITHIUM 75.20 ▲ 1.47% PETR4 41.64 ▼ 0.05% VALE3 72.97 ▲ 0.83% ITUB4 38.60 ▼ 1.03% BBDC4 16.85 ▲ 0.36% ABEV3 14.89 ▼ 0.80% BBAS3 19.37 ▲ 0.47% B3SA3 14.26 ▼ 0.21% WEGE3 47.59 ▲ 0.49% PRIO3 59.14 ▼ 0.19% SUZB3 41.33 ▲ 2.35% RENT3 34.68 ▼ 0.09% AZZA3 15.89 ▼ 2.63% CSAN3 3.22 ▼ 1.83% RAIZ4 0.25 — 0.00% PCAR3 2.75 ▼ 0.36% GMAT3 3.65 ▼ 1.08% PSSA3 48.13 ▼ 0.54% CVCB3 1.33 ▼ 2.92% POSI3 3.36 ▲ 2.44% SLCE3 13.34 ▲ 0.30% NATU3 8.14 ▼ 0.73%
since 2009
Wednesday, September 23, 2026

Manufacturing Employment in Mexico Faces Prolonged Decline

By · October 23, 2024 · 2 min read

The LatAm Brief

One email, every weekday morning. What moved in Latin American markets, politics and expat life.

Yesterday’s subject line: “68 strikes, 223 people. A UN expert says murder.”

Free. We send a confirmation link first — nothing arrives until you click it. Unsubscribe with one click in any edition. If you stop opening us for 30 days we stop sending by ourselves, as we assume the interest is no longer there. See our privacy policy. We never share your email.

For 18 consecutive months, manufacturing employment in Mexico has experienced a steady decline, indicating a faster cooling of the sector compared to production levels.

In August 2024, employment within the transformation industry fell by 0.3% from the previous month. It also decreased by 2.3% compared to August 2023.

This trend has persisted since March 2023, when the industry last saw a marginal annual increase of 0.1%. The decline in manufacturing jobs is unusual for the Mexican economy.

Since 2007, significant drops have only occurred during the global financial crisis of 2008-2009, the COVID-19 pandemic in 2020, and now in 2023. Several factors contribute to this downturn.

Firstly, the sector’s overall weakness is evident. Manufacturing activity contracted by 0.3% in the first half of 2024, contrasting with a growth of 1.9% during the same period in 2023. This reflects a widespread fragility within the industry.
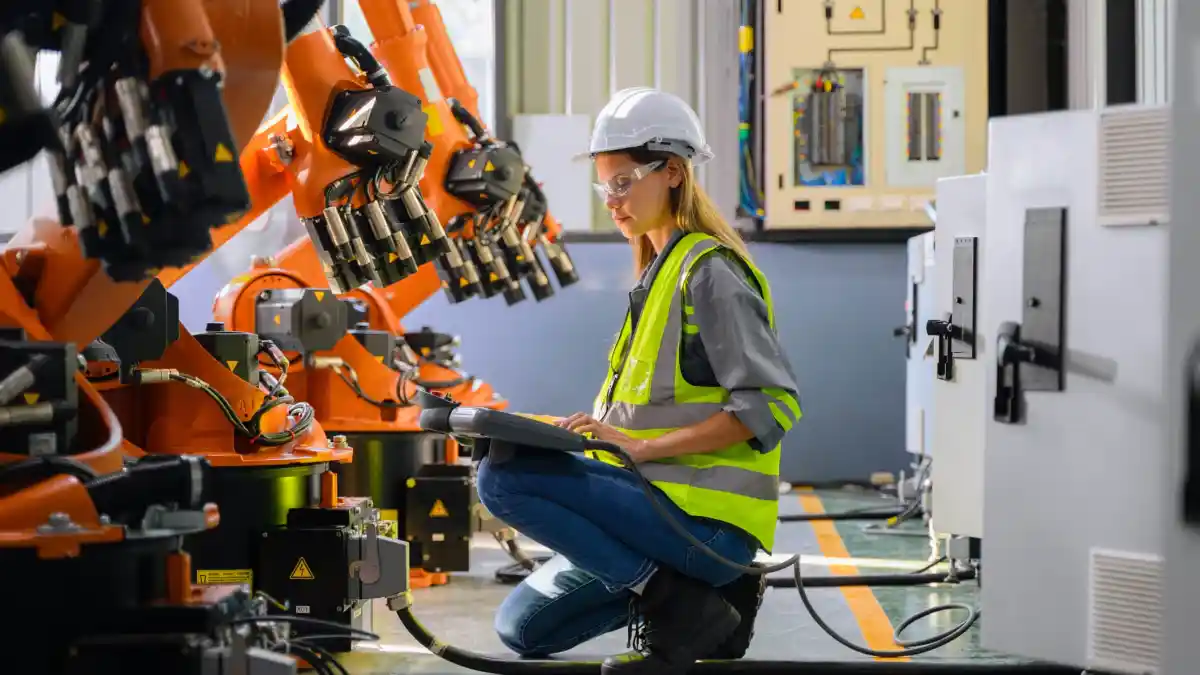
Manufacturing Employment in Mexico Faces Prolonged Decline
Manufacturing Employment in Mexico Faces Prolonged Decline.
One-stop reference
Company Intelligence
Every listed company in Latin America — financials, ownership and structure for 1,450+ companies across 26 exchanges, in one place.
Browse the directory →
RT
Ask Rio Times
17 years of Latin America reporting, on demand.
Open the full Ask Rio Times →

Secondly, international competition has impacted certain sectors more severely. The textile and fashion industries, for example, face stiff competition from Asia, leading to substantial job losses.

Lastly, some industries have struggled to recover fully from the pandemic’s effects, limiting their ability to sustain or grow their workforce.

Revitalizing Mexico’s Manufacturing Sector

Despite these challenges, potential opportunities exist for revitalizing Mexico‘s manufacturing sector. Nearshoring could play a significant role in this recovery.

In addition, the relocation of industrial capabilities to Mexico is expected to create between two and four million additional jobs by 2030.

Moreover, adopting advanced technologies like artificial intelligence and the Internet of Things (IoT) can enhance operational efficiency and flexibility. This technological shift could offset job losses by creating new specialized roles.

Additionally, transitioning towards clean energy offers new employment opportunities within manufacturing, particularly in areas focusing on sustainability and energy efficiency.

While the current state of manufacturing employment in Mexico presents challenges, strategic initiatives focusing on technology and sustainability could drive long-term recovery and growth.

This article was produced by The Rio Times’ automated newsroom system. How we use AI · Report an error

Read More from The Rio Times

The Rio Times · Power Map
See who really holds power in Latin America
Click to open the Power Map

Rotate for Best Experience

This report is optimized for landscape viewing. Rotate your phone for the full experience.