IBOV 170,934.30 ▲ 1.79% IPSA 11,379.66 ▲ 1.26% IPC MEX 65,223.89 ▲ 1.36% MERVAL 2,904,791 ▲ 1.00% COLCAP 2,465.35 ▲ 0.86% BVL PERÚ 58,698.13 ▲ 2.27% USD/BRL5.14▼ 1.08% USD/MXN16.92▼ 0.22% USD/CLP914.28▼ 0.85% USD/COP3,037▼ 0.47% USD/PEN3.35▼ 0.17% USD/ARS1,499▲ 0.12% USD/UYU40.20▲ 1.58% USD/PYG5,996▲ 1.55% USD/BOB11.43▲ 0.41% USD/DOP58.82▲ 0.20% USD/CRC450.05▲ 3.34% USD/GTQ7.62▲ 2.21% USD/HNL26.81▲ 0.31% USD/NIO36.62▲ 0.29% USD/VES778.00▼ 0.13% USD/PAB1.00— 0.00% USD/BZD2.00— 0.00% USD/JMD 157.28 — 0.00% USD/TTD6.71▲ 0.79% EUR/BRL6.00▼ 0.62% BRENT 88.88 ▼ 0.03% WTI 83.11 ▼ 0.11% IRON ORE 161.91 — — COPPER 6.61 ▲ 0.03% GOLD 4,461 ▲ 1.78% SILVER 65.59 ▲ 1.26% SOY 1,184 ▲ 3.20% CORN 480.50 ▲ 10.02% WHEAT 655.00 ▲ 3.93% COFFEE 317.25 ▼ 5.51% SUGAR 16.43 ▼ 1.79% ORANGE JUICE 138.55 ▼ 0.47% COTTON 85.03 ▲ 2.33% COCOA 5,719 ▲ 3.18% BEEF 223.60 ▼ 3.93% CATTLE 339.10 ▼ 3.16% LITHIUM 75.20 ▲ 1.47% PETR4 41.64 ▼ 0.05% VALE3 72.97 ▲ 0.83% ITUB4 38.60 ▼ 1.03% BBDC4 16.85 ▲ 0.36% ABEV3 14.89 ▼ 0.80% BBAS3 19.37 ▲ 0.47% B3SA3 14.26 ▼ 0.21% WEGE3 47.59 ▲ 0.49% PRIO3 59.14 ▼ 0.19% SUZB3 41.33 ▲ 2.35% RENT3 34.68 ▼ 0.09% AZZA3 15.89 ▼ 2.63% CSAN3 3.22 ▼ 1.83% RAIZ4 0.25 — 0.00% PCAR3 2.75 ▼ 0.36% GMAT3 3.65 ▼ 1.08% PSSA3 48.13 ▼ 0.54% CVCB3 1.33 ▼ 2.92% POSI3 3.36 ▲ 2.44% SLCE3 13.34 ▲ 0.30% NATU3 8.14 ▼ 0.73% IBOV 170,934.30 ▲ 1.79% IPSA 11,379.66 ▲ 1.26% IPC MEX 65,223.89 ▲ 1.36% MERVAL 2,904,791 ▲ 1.00% COLCAP 2,465.35 ▲ 0.86% BVL PERÚ 58,698.13 ▲ 2.27% USD/BRL 5.16 ▲ 0.01% USD/MXN 17.06 ▼ 0.24% USD/CLP 913.98 ▲ 0.04% USD/COP 3,140 ▲ 0.03% USD/PEN 3.36 ▼ 0.66% USD/ARS 1,493 ▲ 0.10% USD/UYU 40.27 ▲ 1.24% USD/PYG 5,939 ▲ 1.68% USD/BOB 11.64 ▼ 0.76% USD/DOP 58.34 ▲ 1.25% USD/CRC 445.92 ▲ 0.89% USD/GTQ 7.62 ▲ 2.21% USD/HNL 26.79 ▲ 1.57% USD/NIO 36.62 ▲ 0.69% USD/VES 762.44 ▼ 0.13% USD/PAB 1.00 — 0.00% USD/BZD 2.00 — 0.00% USD/JMD 157.28 — 0.00% USD/TTD 6.70 ▲ 0.61% EUR/BRL 5.95 ▲ 1.01% BRENT 88.88 ▼ 0.03% WTI 83.11 ▼ 0.11% IRON ORE 161.91 — — COPPER 6.61 ▲ 0.03% GOLD 4,461 ▲ 1.78% SILVER 65.59 ▲ 1.26% SOY 1,184 ▲ 3.20% CORN 480.50 ▲ 10.02% WHEAT 655.00 ▲ 3.93% COFFEE 317.25 ▼ 5.51% SUGAR 16.43 ▼ 1.79% ORANGE JUICE 138.55 ▼ 0.47% COTTON 85.03 ▲ 2.33% COCOA 5,719 ▲ 3.18% BEEF 223.60 ▼ 3.93% CATTLE 339.10 ▼ 3.16% LITHIUM 75.20 ▲ 1.47% PETR4 41.64 ▼ 0.05% VALE3 72.97 ▲ 0.83% ITUB4 38.60 ▼ 1.03% BBDC4 16.85 ▲ 0.36% ABEV3 14.89 ▼ 0.80% BBAS3 19.37 ▲ 0.47% B3SA3 14.26 ▼ 0.21% WEGE3 47.59 ▲ 0.49% PRIO3 59.14 ▼ 0.19% SUZB3 41.33 ▲ 2.35% RENT3 34.68 ▼ 0.09% AZZA3 15.89 ▼ 2.63% CSAN3 3.22 ▼ 1.83% RAIZ4 0.25 — 0.00% PCAR3 2.75 ▼ 0.36% GMAT3 3.65 ▼ 1.08% PSSA3 48.13 ▼ 0.54% CVCB3 1.33 ▼ 2.92% POSI3 3.36 ▲ 2.44% SLCE3 13.34 ▲ 0.30% NATU3 8.14 ▼ 0.73%
since 2009
Friday, August 21, 2026

North America Mexico

Mexico Leads North American Manufacturing Growth in Recent Years

By · September 26, 2024 · 2 min read

Daily Brief

The morning intel from across Latin America. Free.

By subscribing you agree to our privacy policy. We never share your email.

The United Nations Industrial Development Organization (UNIDO) has released data on North American manufacturing growth.

This data reveals Mexico’s manufacturing sector has outperformed both the United States and Canada in recent years.

The COVID-19 pandemic hit all three countries hard in 2020. Mexico’s manufacturing output fell 9.3%, while the US and Canada saw declines of 6.3% and 9.6% respectively.

Mexico bounced back strongly in the following years. Its manufacturing production grew by 9.4% in 2021, 6.4% in 2022, and 1.0% in 2023.

The US and Canada experienced more modest recoveries. US manufacturing grew 5.1% in 2021, 2.9% in 2022, and declined 0.6% in 2023.

Canada’s figures were slightly better, with growth of 5.8% in 2021, 3.7% in 2022, and 0.7% in 2023.
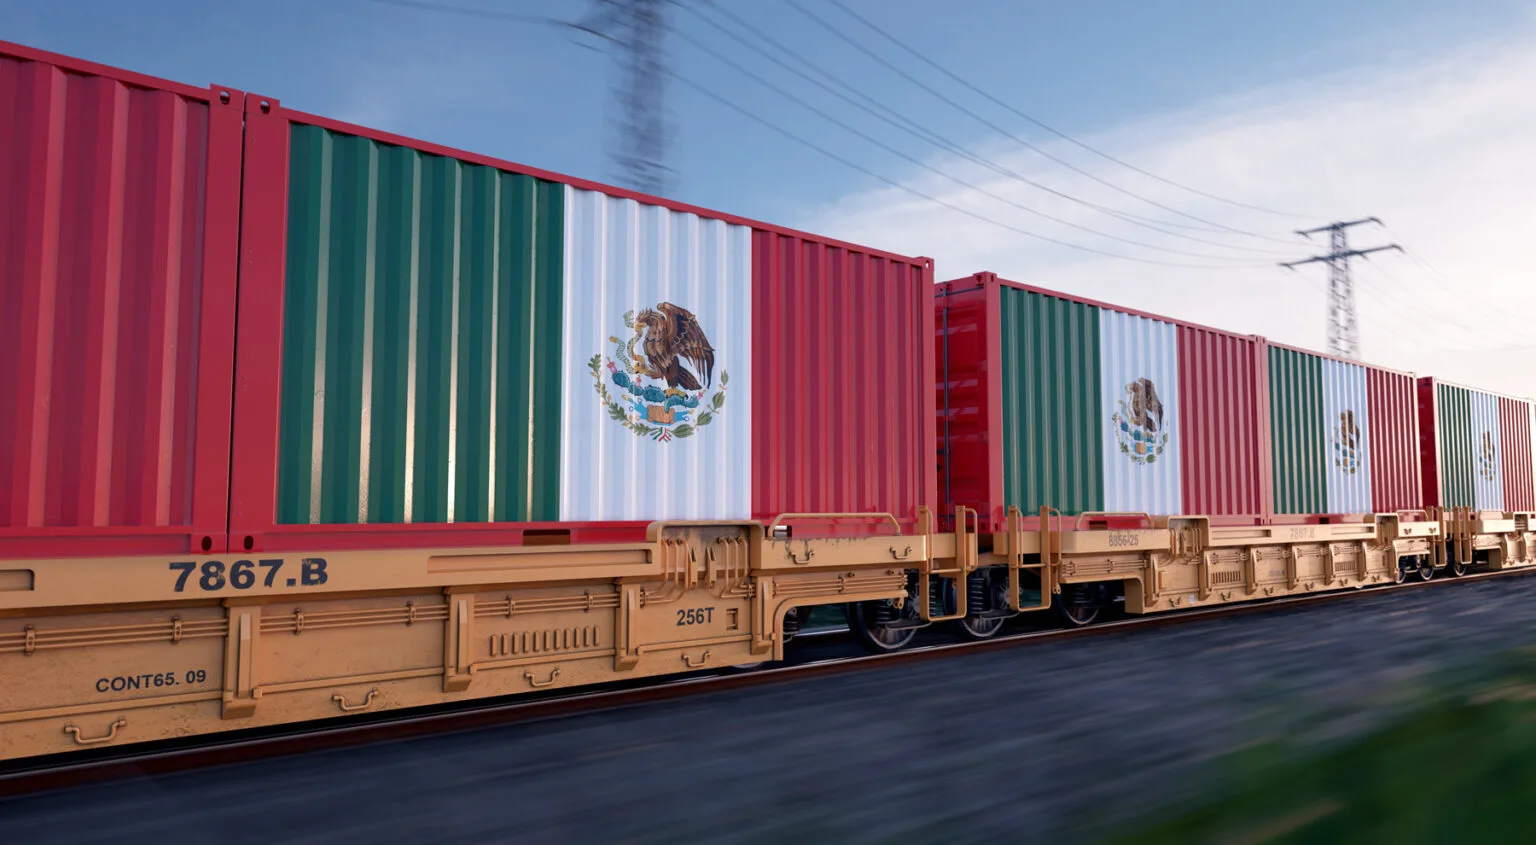
Mexico Leads North American Manufacturing Growth in Recent Years. (Photo Internet reproduction)
One-stop reference
Company Intelligence
Every listed company in Latin America — financials, ownership and structure for 1,450+ companies across 26 exchanges, in one place.
Browse the directory →
RT
Ask Rio Times
17 years of Latin America reporting, on demand.
Open the full Ask Rio Times →

Mexico benefited greatly from US economic stimulus measures in 2021 and 2022. These policies boosted consumer demand and increased orders for Mexican-made goods.

Mexican manufacturing exports, primarily destined for the US, grew by 16.7% in 2021 and 16.6% in 2022.

The upcoming US election has brought trade issues to the forefront. Republican candidate Donald Trump has proposed significant tariffs on certain Mexican imports.

Trump threatened a 200% tariff on John Deere tractors if production moves to Mexico. He also suggested a 100% tariff on Mexican-made cars.

Mexico’s manufacturing growth even surpassed China’s in 2022. Mexico’s output increased by 6.4%, while China’s grew by 2.7%.

However, China maintained stronger growth in 2020, 2021, and 2023. Global manufacturing growth slowed to 1.2% in 2023, down from 2.9% in 2022.

Developing economies generally outperformed industrialized nations in manufacturing growth. India and China led among major US trading partners, with 5.1% and 4.7% growth in 2023.

Mexico Leads North American Manufacturing Growth in Recent Years

The UK’s manufacturing sector grew at the global average of 1.2%. Mexico’s growth rate was 1.0%. The US, Canada, Japan, and EU saw declines.

High-tech industries drove global production increases in 2023. Motor vehicles, transportation equipment, and electrical equipment saw significant growth.

Some sectors experienced declines, including furniture, leather goods, and apparel. Despite manufacturing growth, global merchandise trade contracted in 2023.

The World Trade Organization attributes this decline to challenging macroeconomic conditions, particularly inflationary pressures.

US-China trade relations remained complex in 2023. Key developments included tariff reviews, export controls, and human rights-related trade measures.

The motor vehicle industry led manufacturing growth globally, with a 10.5% increase in production for 2023.

Key Facts

Deep Dive

For the complete picture, read our in-depth guide: Mexico Economy 2026: GDP, Peso, Nearshoring, Banxico and Trade

This article was produced by The Rio Times’ automated newsroom system. How we use AI · Report an error

Read More from The Rio Times

The Rio Times · Power Map
See who really holds power in Latin America
Click to open the Power Map

Rotate for Best Experience

This report is optimized for landscape viewing. Rotate your phone for the full experience.