Wheat Fund Falls 0.91% to a Six-Month Low | Grains Wrap, Nov 6

Key Facts
- Wheat sank to a six-month low: the wheat-tracking fund closed at US$21.73, down 0.91% on the day and 22.4% below its 28.00 peak of 28 August.
- Soybeans bounced only slightly: the soybean-tracking fund ended at US$25.32, up 0.08%, after falling 3.14% over five sessions.
- Corn edged up: the corn-tracking fund finished at US$17.19, +0.23%, still 15.3% below its 1 September high of 20.29.
- Brazil’s crop is growing slowly: Conab, the state crop agency, sees soybeans at 181.64 million tonnes, up 0.7%, from 49.3 million hectares.
- Planting is well under way: about 40% of Brazil’s soybean area was sown by 22 October, according to AgRural, a Brazilian crop consultancy.
Today’s Focus
Wheat was the weak link on Friday, 6 November 2026. The wheat-tracking fund fell 0.91% to US$21.73, its lowest close in at least six months, and 10.98% lower than 20 sessions ago.
Soybeans and corn rose only a little, which after a hard week felt more like catching breath than a recovery. Soybeans are 8.03% lower over 20 sessions and corn 6.68% lower.
The pressure is plentiful supply. Brazil, the world’s biggest soybean exporter, is planting faster than last year, while China is again buying from the United States, which shares out a market Brazil has dominated.
A firmer US dollar, up 0.72% on the day on the dollar index, also makes American grain dearer for foreign buyers.
What matters today. Cheap grain is good news for food importers and a squeeze for Latin American farmers, whose export income falls with prices.
01 The session in one read
Think of a grain market as a very large pantry: when the shelves are full, prices drop. On Friday, 6 November 2026, wheat showed it most clearly, closing at its lowest in at least six months.
The wheat-tracking fund lost 0.91%, its second fall in a row. Soybeans rose 0.08% and corn +0.23%, modest gains after a week that analysts described as a bloodbath for grains and livestock.
The weight of evidence points to a market with ample supply and a stronger dollar, not a collapse in demand, and the small gains in soybeans and corn look like a pause rather than a turn. Our confidence is medium because we lack settled figures from China or the US government’s crop report. The variable to watch is the US crop report due in the coming days, which will reset expectations for soybean supply.
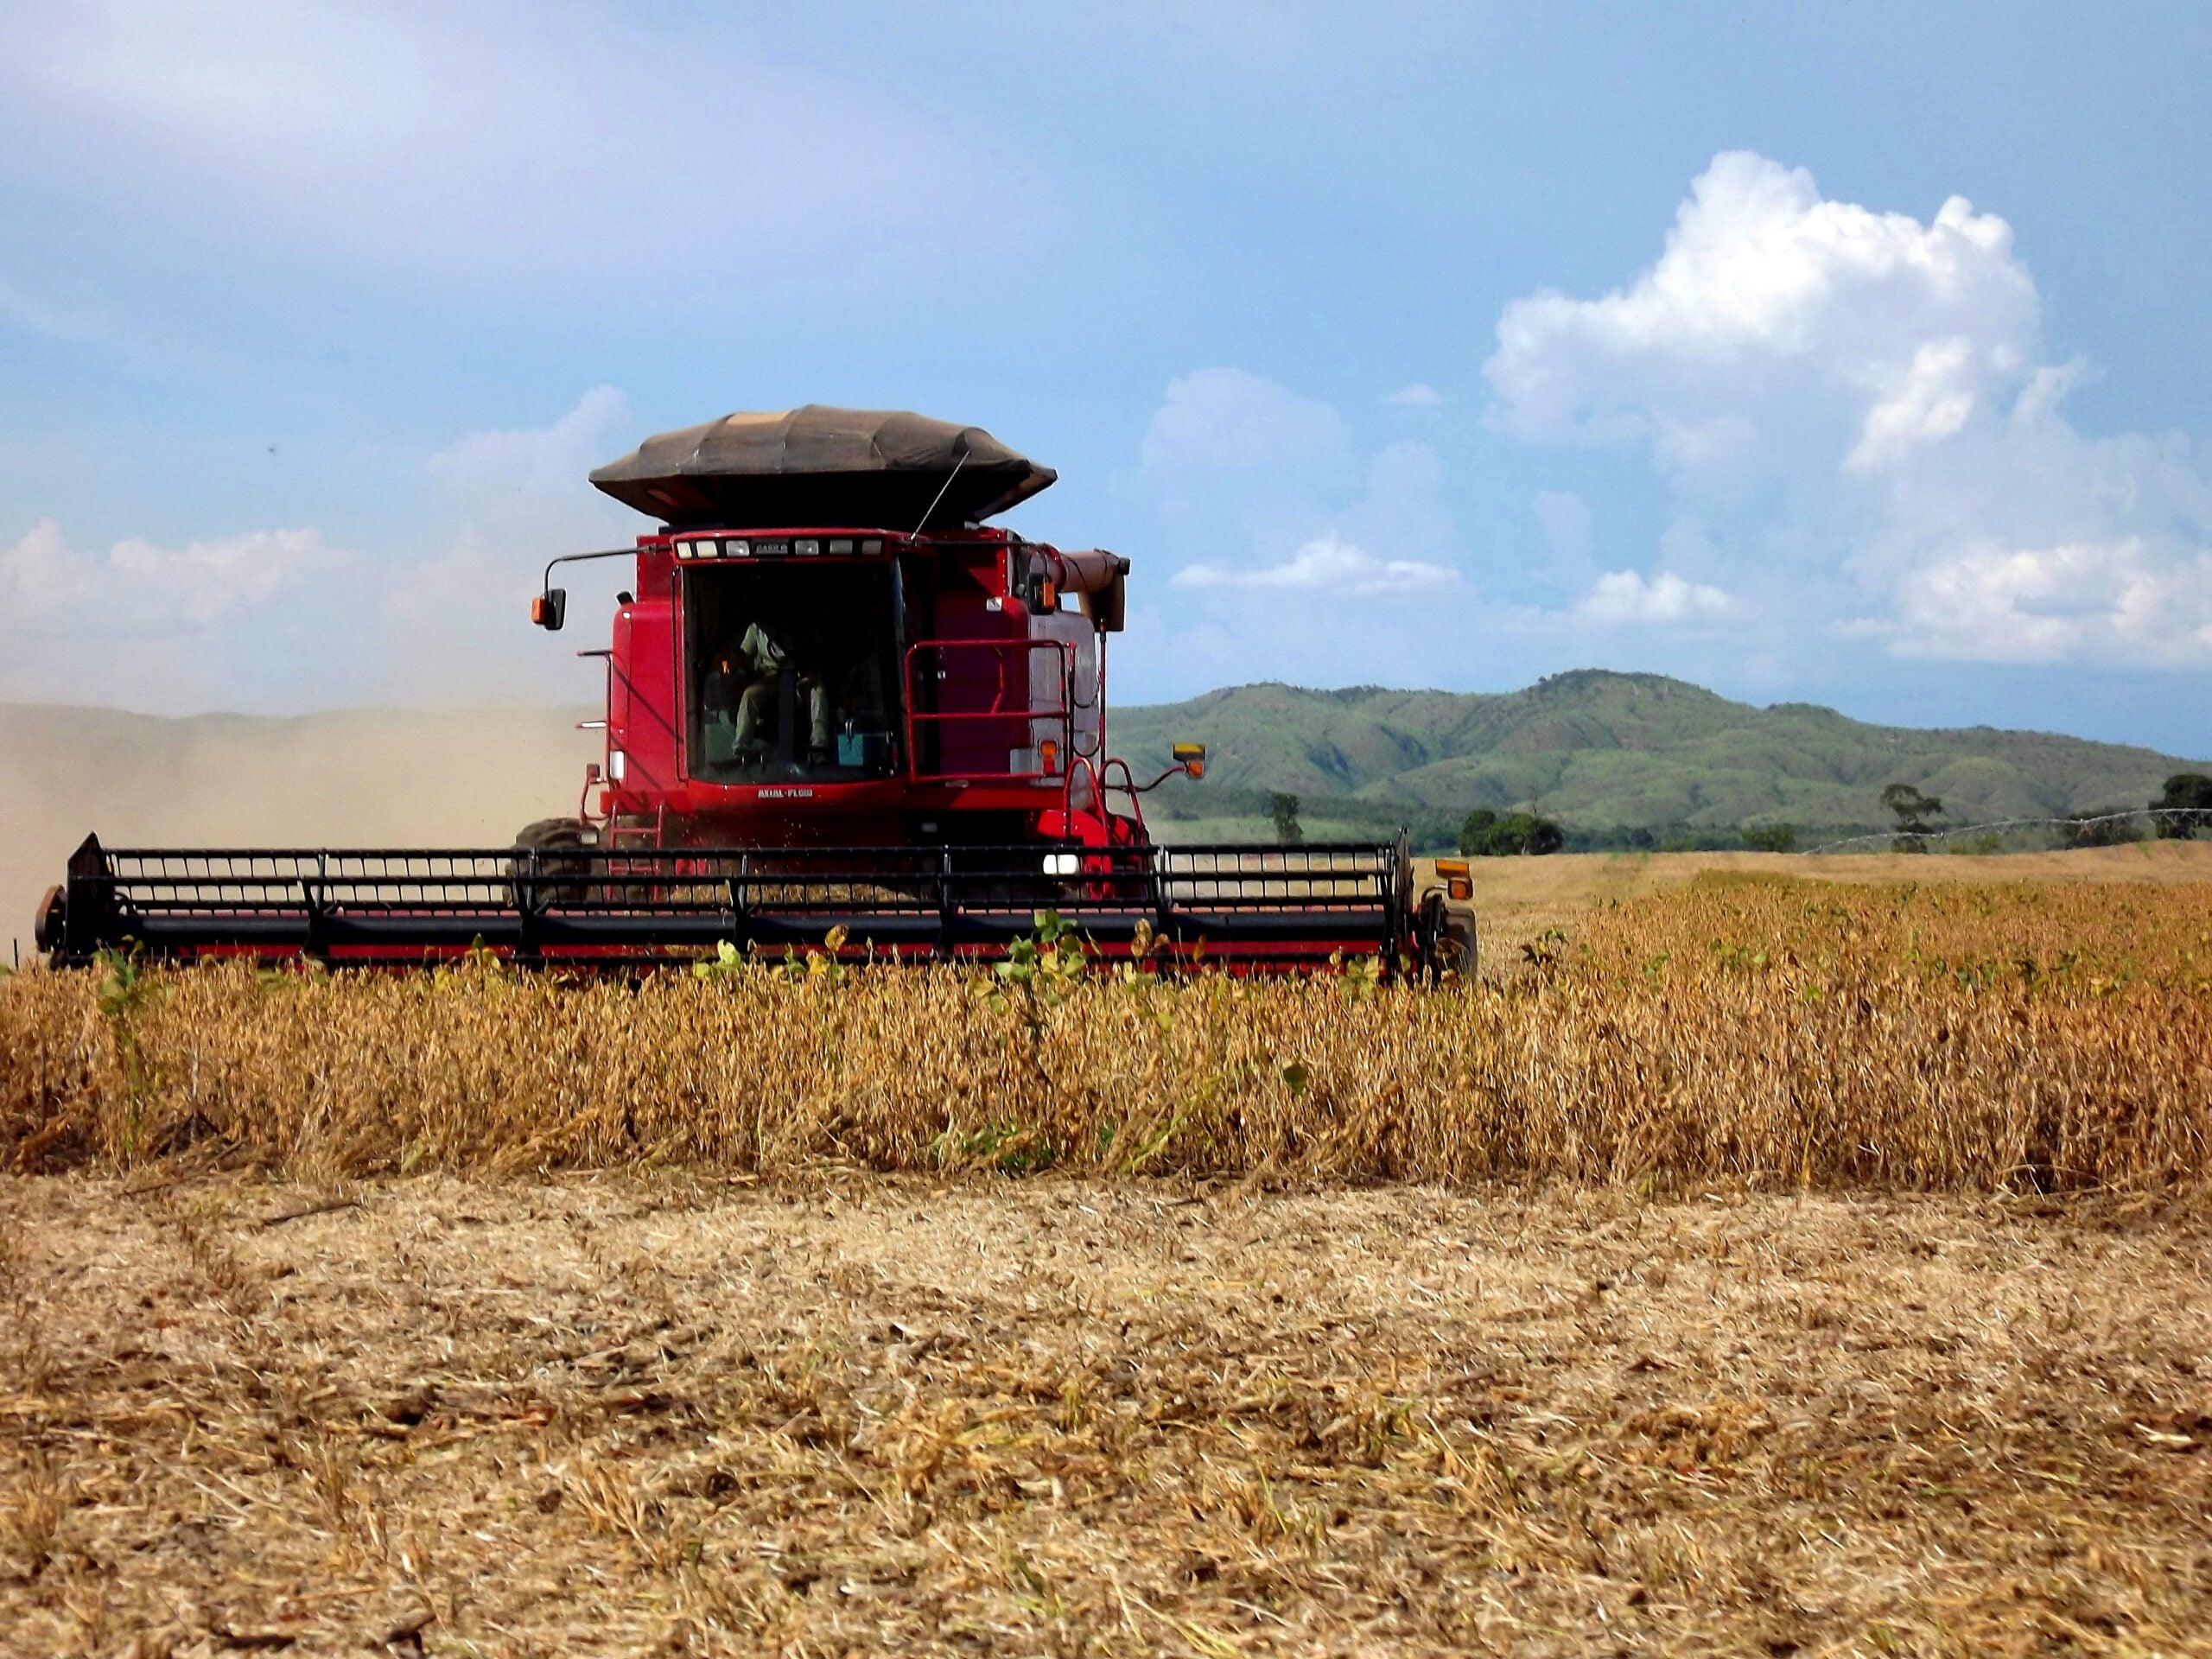
02 The board
These funds are proxies: they follow grain futures rather than the physical commodity. Wheat’s tracker closed at US$21.73, soybeans’ at US$25.32 and corn’s at US$17.19.
Only wheat ended the day lower, but the five-session picture is negative for all three: wheat down 2.12%, soybeans down 3.14% and corn down 0.87%.
| Asset | Level | Change |
|---|---|---|
| Soybeans (SOYB) | US$25.32 | +0.08% |
| Corn (CORN) | US$17.19 | +0.23% |
| Wheat (WEAT) | US$21.73 | -0.91% |
Source: RT close, 2026-11-06. Where a commodity has no spot feed, an exchange-traded tracker or leading producer is shown as a labelled proxy.
Live Market IntelligenceThe live market board
Rio Times · Live Market Intelligence
Latin America — Cross-Market Board
| Instrument | Last | Change | YoY | Prev. | High | Low | Volume |
|---|---|---|---|---|---|---|---|
| IBOV | 168,498.45 | +1.39% | +9.89% | 166,191.45 | 169,073 | 165,910 | — |
| IPSA | 10,536.40 | +0.68% | — | 10,465.25 | 10,617 | 10,511 | — |
| IPC MEX | 70,968.43 | -0.17% | +13.16% | 71,087.56 | 71,469 | 70,635 | 145,640,378 |
| MERVAL | 2,848,945 | — | -4.19% | 2,859,051 | — | — | — |
| COLCAP | 2,485.26 | +0.03% | — | — | — | — | — |
| USD/BRL | 5.50 | -0.17% | +2.56% | 5.51 | 5.53 | 5.48 | — |
| EUR/BRL | 6.13 | +0.07% | -0.35% | 6.13 | 6.17 | 6.12 | — |
| USD/MXN | 18.60 | -0.84% | +0.04% | 18.76 | 18.81 | 18.57 | — |
| USD/CLP | 975.74 | -0.29% | +3.43% | 978.59 | 983.51 | 973.55 | — |
| USD/COP | 3,240 | +0.38% | -15.48% | 3,227 | 3,252 | 3,219 | — |
| USD/PEN | 3.44 | -0.15% | +3.80% | 3.45 | 3.46 | 3.42 | — |
| USD/ARS | 1,545 | +0.00% | +6.50% | 1,545 | 1,545 | 1,545 | — |
| USD/UYU | 40.31 | +3.48% | +2.73% | 38.95 | 40.31 | 40.22 | — |
| USD/PYG | 6,358 | +8.23% | -8.70% | 5,875 | 6,358 | 6,358 | — |
| USD/BOB | 11.81 | +0.40% | +75.39% | 11.76 | 11.92 | 11.81 | — |
| USD/DOP | 60.56 | +0.43% | -5.45% | 60.30 | 60.59 | 59.79 | — |
| USD/CRC | 448.27 | +1.89% | -8.45% | 439.97 | 449.63 | 448.27 | — |
| USD/GTQ | 7.64 | +3.24% | +2.07% | 7.40 | 7.64 | 7.64 | — |
03 Why it moved
First and heaviest is supply. Brazil’s Conab forecasts a 2026/27 soybean crop of 181.64 million tonnes, up 0.7%, and about 40% of the area had been planted by 22 October, according to AgRural, a Brazilian crop consultancy. Fast planting usually means an early harvest and earlier export competition.
Second is the dollar. The dollar index rose 0.72% on the day to 102.28, and the US 10-year yield added 3 basis points to 4.87%. A dearer dollar makes US grain costlier in other currencies and often draws money out of commodities.
Third is the trade map: China, which takes most of Brazil’s soybean exports, is also a buyer of American beans, which can take business from Brazil.
Markets also show mixed signals: the S&P 500 rose 0.31%, yet the VIX fear gauge is 32.03% higher over five sessions, so nerves remain. Our confidence in supply and the dollar as the main causes is medium.
04 The trend behind it
Soybeans are 10.0% below their 12-month high of 28.14 on 10 September, yet 16.6% above their January low of 21.71. Corn is 15.3% below its 20.29 high of 1 September and only 4.4% above its 16.47 low of 29 June.
Wheat is the starkest: 22.4% below its 28.00 high of 28 August, with a 60-session fall of 10.6%. This looks like a continuation of the slide from late summer, not a new phase.
History is not a forecast, but our own records since 2011 are instructive. After earlier falls as large as soybeans’ 8.0%, the price was higher 20 sessions later in 17 of 25 cases (68%), with a median gain of 1.1% and a worst result of a 6.0% fall. For wheat, after 25 similar falls, it was higher in only 11 (44%), with a median of 0.0% and a worst case of a 23.9% fall.
05 What it means for Latin America
Brazil and Argentina are the world’s export engine for soybeans and their products, so lower prices cut farm income and export earnings in both countries. A stronger dollar partly cushions Brazilian growers, who sell in dollars but pay costs in reais.
Brazil’s slower crop growth, with area up 1.4% and yields eased by about 0.8%, shows farmers are cautious about investing. Conab cites that caution and El Niño uncertainty, a Pacific weather pattern that can disrupt rains.
Importers across the region, from Mexico’s tortilla makers to Peru’s bakers, benefit from cheaper wheat and corn.
06 The names to watch
The three trackers are the clearest reading: the wheat fund for the weakest link, the soybean fund for the China story and the corn fund for the harvest.
Also watch Conab’s next crop update and Brazilian port data, since China took 71% of Brazil’s soybean exports in early 2026, according to figures from the exporters’ association Anec.
07 What would end it
Soybeans would need to hold above their 20-session slide and move back toward the 28.14 September high to signal a real turn; the nearer test is the 25.32 level they are sitting on, with 21.71 as the deep floor. For corn, the 16.47 June low is the line to watch, and for wheat the six-month low just set.
The next dated catalyst is the November World Agricultural Supply and Demand Estimates, the US government’s monthly crop report, in which soybeans are seen as the biggest wildcard. Does this stop? Probably only when either China buying firms up or the dollar softens.
08 What to watch
- US crop report: The November supply and demand estimates could reset soybean expectations.
- The dollar: A fall from 102.28 on the dollar index would ease pressure on grain prices.
- Brazil planting: Progress beyond about 40% and any El Niño weather disruption.
Frequently Asked Questions
Why did wheat fall?
Ample supply and a stronger dollar pushed the wheat-tracking fund to its lowest close in at least six months.
Is Brazil growing more soybeans?
Yes, but slowly: Conab forecasts 181.64 million tonnes, up 0.7%.
Does China matter?
Greatly: it buys most of Brazil’s soybean exports, and reports of US purchases shift that balance.
Is this a forecast?
No. Our history shows how earlier falls ended, but it does not predict what comes next.
Market data: The Rio Times
This article was produced by The Rio Times’ automated newsroom system. How we use AI · Report an error · Editorial responsibility: Matthias Camenzind, Editor-in-Chief
LatAm Markets: Live Signals → — real-time movers, turnover leaders and FX across Latin America.