
SOUTH AFRICA · JOBS
Statistics South Africa (Stats SA), the national statistics office, said on Tuesday 10 November 2026 that official unemployment rose to 33.7% in July to September. That is up 0.1 point from 33.6% in the second quarter, according to its Quarterly Labour Force Survey (QLFS), the country’s main official jobs gauge.
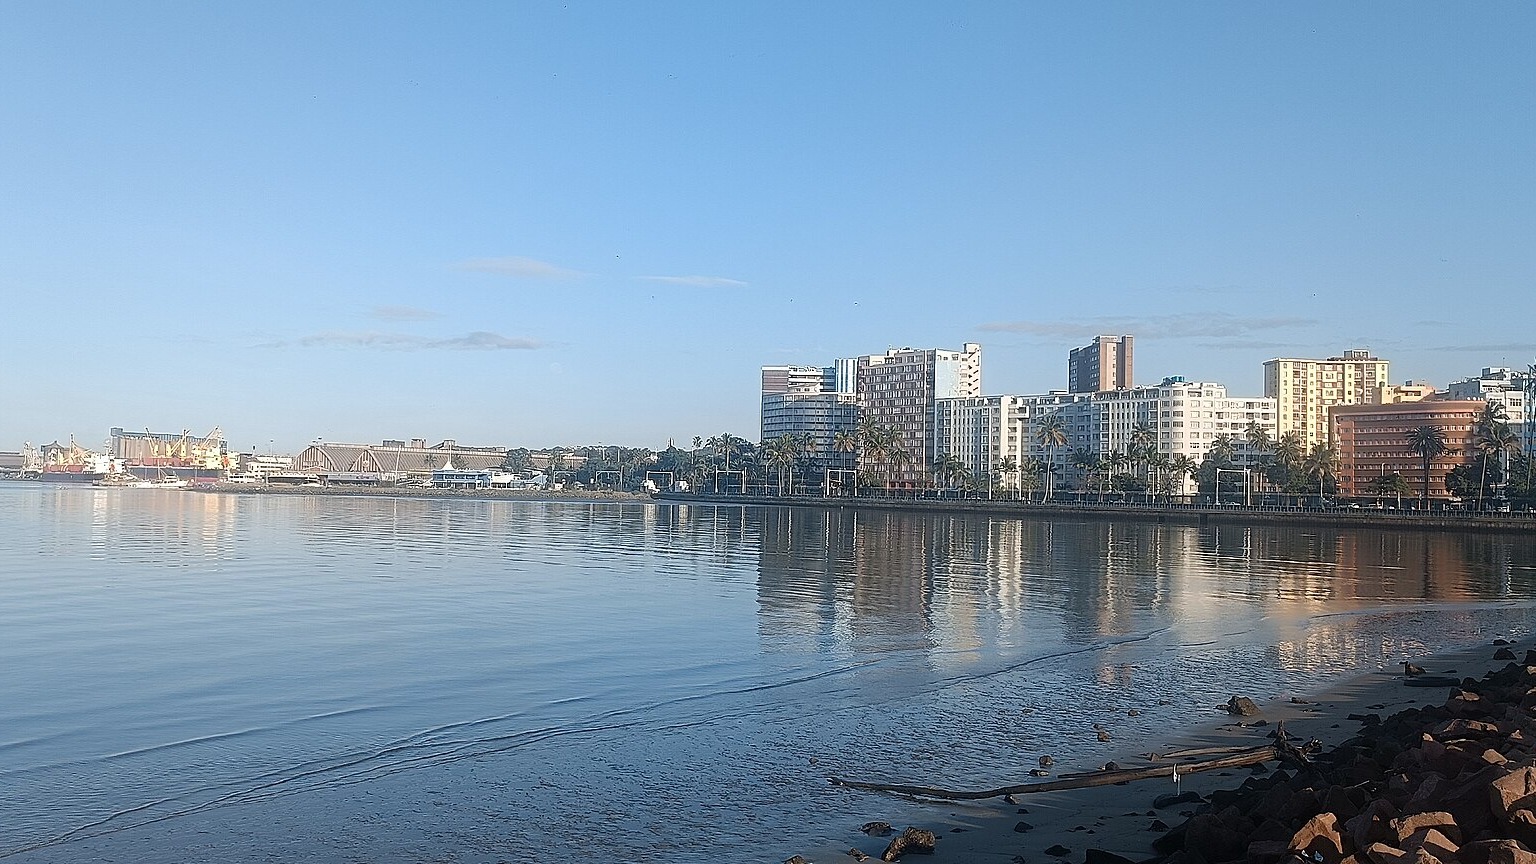
The Durban area looks very different in the latest metro data we have confirmed. eThekwini, the metropolitan municipality around Durban, had the lowest rate of South Africa’s metros in the second quarter, at 21.2%. The wider South African economy and its coalition government still face a national rate near one in three.
That national figure was 33.6% in the same April to June quarter.
Key Facts
- Who Stats SA, South Africa’s national statistics office, released its quarterly jobs survey on 10 November 2026.
- What National unemployment is 33.7%, up 0.1 point; youth unemployment is 47.3%.
- Why Durban’s metro rate was 21.2% in April to June, the lowest of South Africa’s metros.
- As of 10 November 2026, 22:00 GMT
In Plain English
eThekwini: the metropolitan municipality that governs Durban and its surrounding area.
Metro: one of South Africa’s largest city governments.
QLFS: the Quarterly Labour Force Survey, Stats SA’s main household survey of work.
What the National Survey Found
Stats SA said 16.8 million people were employed, up 101,000 on the second quarter. It said 8.6 million were unemployed, up 97,000.
Youth unemployment, which counts people aged 15 to 34, fell 0.1 point to 47.3%. That still means nearly half of young people in the labour force were jobless.
Put simply, about one in three South Africans who are actively looking for work cannot find it. Survey estimates carry margins of error, so a 0.1 point change is a signal to watch rather than proof of a trend.
Why Durban Stands Out
The second-quarter survey, covering April to June and published on 11 August 2026, put eThekwini’s rate at 21.2%. The national rate in the same quarter was 33.6%.
A year earlier eThekwini’s rate was 26.8%, so it fell 5.6 percentage points. The number of unemployed residents dropped by 92,000 on the year to 347,000.
Jobs Growth Behind the Fall
Employment in eThekwini reached 1.29 million, up 90,000 on the year. Fewer people searching in vain and more people working moved in the same direction.
Mayor Cyril Xaba of eThekwini said in August that the city does not see the results as a finish line. He said more than 340,000 people in the city were still looking for work.
Political context matters for Durban too, as the city’s municipal election result was contested by a rival party. Jobs data now sits alongside that question of who will run the city.
What It Means for You
Job seekers face very different odds depending on where they live, with the Durban area at 21.2% and the nation at 33.6% in April to June. Young people remain hardest hit nationally, at 47.3% in July to September.
Investors in Durban’s economy can read the second-quarter fall as a sign of a stronger local labour market. The next metro table is the check that matters.
What Is Not Known
We have not seen the Stats SA metro table for July to September, so we do not use a third-quarter figure for Durban. We therefore cannot say how Durban compares with other metros in the latest quarter.
Until the metro table is published and checked, the second-quarter metro data remain our confirmed benchmark. Survey estimates also carry margins of error.
Frequently Asked Questions
What is South Africa’s unemployment rate now?
Stats SA put the official rate at 33.7% for July to September 2026. That is up 0.1 point from 33.6% in the second quarter.
Which South African metro has the lowest unemployment?
In the latest metro data we have confirmed, April to June 2026, it was eThekwini at 21.2%. The national rate that quarter was 33.6%.
Did youth unemployment change?
Stats SA put the youth unemployment rate at 47.3% for July to September 2026, down 0.1 point. That means nearly half of young people in the labour force were jobless.
How many people were unemployed in eThekwini?
In April to June 2026 the metro had 347,000 unemployed residents, down 92,000 on a year earlier. Its rate was 21.2%.
Connected Coverage: See also our South Africa coverage, the economy under the coalition government, the dispute over the eThekwini result, and Ghana’s youth unemployment figures for a comparison.
Sources: Statistics South Africa, Quarterly Labour Force Survey Q3 2026, release of 10 November 2026 (https://www.statssa.gov.za); Statistics South Africa QLFS Q2 2026, release of 11 August 2026; South African government news service, “eThekwini makes strides in employment”, 14 August 2026 (https://www.sanews.gov.za/south-africa/ethekwini-makes-strides-employment).
This article was produced by The Rio Times’ automated AI newsroom. Editorial responsibility: Matthias Camenzind, Publisher and Editor-in-Chief. The Rio Times also runs Ask Rio Times, which answers from 100,000+ of our own articles, the daily Latin America Power Map, and prediction-market odds on elections and markets.. How we use AI · Report an error
Living in or visiting Durban? See this month's events and our Durban city guide with rents, safety and upcoming concerts.