IBOV 177,547.57 ▲ 2.44% IPSA 11,009.22 ▲ 0.50% IPC MEX 67,298.78 ▲ 0.88% MERVAL 3,379,771 ▲ 2.98% COLCAP 2,297.00 ▼ 0.19% BVL PERÚ 57,575.02 — — USD/BRL5.06▲ 0.05% USD/MXN17.44▲ 0.31% USD/CLP937.27▲ 0.17% USD/COP3,204▼ 0.73% USD/PEN3.39▼ 0.31% USD/ARS1,482▼ 0.03% USD/UYU40.14▲ 1.16% USD/PYG6,035▲ 1.38% USD/BOB10.95▲ 2.82% USD/DOP57.92▼ 0.14% USD/CRC447.42▲ 1.36% USD/GTQ7.62▲ 2.31% USD/HNL26.74▲ 1.52% USD/NIO36.62▲ 0.31% USD/VES736.04▼ 0.13% USD/PAB1.00— 0.00% USD/BZD2.00— 0.00% USD/JMD157.49▲ 0.36% USD/TTD6.71▲ 0.76% EUR/BRL5.77▼ 0.48% BRENT 86.40 ▼ 8.15% WTI 90.04 ▲ 3.70% IRON ORE 161.91 — — COPPER 6.46 ▲ 0.20% GOLD 4,099 ▼ 1.16% SILVER 59.19 ▼ 1.39% SOY 1,241 ▲ 0.63% CORN 485.75 ▲ 5.14% WHEAT 702.75 ▼ 0.43% COFFEE 301.65 ▼ 4.74% SUGAR 14.81 ▲ 0.47% ORANGE JUICE 147.50 ▲ 2.57% COTTON 81.06 ▲ 1.49% COCOA 5,527 ▲ 3.73% BEEF 219.20 ▼ 3.30% CATTLE 336.15 ▼ 3.83% LITHIUM 69.00 ▼ 0.12% PETR4 42.58 ▲ 2.21% VALE3 75.10 ▲ 3.96% ITUB4 42.90 ▲ 0.87% BBDC4 18.97 ▲ 2.26% ABEV3 16.13 ▲ 2.09% BBAS3 21.09 ▲ 1.01% B3SA3 15.90 ▲ 4.81% WEGE3 46.74 ▲ 10.05% PRIO3 59.77 ▲ 2.73% SUZB3 42.66 ▲ 2.47% RENT3 37.14 ▲ 1.61% AZZA3 17.81 ▲ 1.89% CSAN3 3.92 ▲ 3.70% RAIZ4 0.27 — 0.00% PCAR3 2.75 ▲ 0.73% GMAT3 3.91 ▲ 2.09% PSSA3 55.45 ▲ 3.68% CVCB3 1.27 ▲ 13.39% POSI3 3.70 ▲ 0.54% SLCE3 13.96 ▲ 1.53% NATU3 8.68 ▼ 0.34% BRKM5 6.07 ▲ 6.30% RANI3 8.00 ▲ 1.39% CSNA3 5.38 ▲ 6.32% CMIN3 5.84 ▲ 4.66% USIM5 8.65 ▲ 2.25% GGBR4 24.06 ▲ 2.43% ENEV3 25.97 ▲ 2.16% CPFE3 46.71 ▲ 0.67% CMIG4 11.21 ▲ 1.72% EQTL3 39.35 ▲ 1.34% LREN3 13.54 ▲ 2.03% VIVT3 35.38 ▼ 1.17% RAIL3 13.64 ▲ 3.02% KLABIN 17.93 ▲ 1.93% RAIA DROGASIL 18.29 ▲ 0.88% RDOR3 34.49 ▲ 1.68% HAPV3 11.39 ▲ 1.33% FLRY3 16.65 ▲ 0.60% SMTO3 16.05 ▲ 3.02% UGPA3 32.83 ▲ 3.17% VBBR3 34.98 ▲ 3.03% BBSE3 42.58 ▲ 2.48% BPAC11 57.02 ▲ 2.98% CURY3 30.20 ▲ 0.83% AERI3 2.05 ▲ 0.49% VIVARA 21.55 ▲ 0.65% COMPASS 24.81 ▲ 1.51% VAMOS 3.23 ▲ 4.53% SANB11 26.95 ▼ 0.96% ASAI3 8.40 ▲ 1.82% SBSP3 29.29 ▲ 2.41% WALMEX 48.65 ▼ 1.02% GMEXICO 214.34 ▲ 2.57% FEMSA 227.98 ▲ 0.55% CEMEX 22.17 ▲ 0.45% GFNORTE 191.99 ▲ 3.33% BIMBO 60.30 ▲ 1.53% TELEVISA 9.82 ▲ 0.61% AMX 22.70 ▼ 0.26% GAP 378.40 ▼ 0.03% ASUR 273.53 ▼ 0.52% OMA 229.62 ▲ 1.49% KOF 182.55 ▲ 1.15% GRUMA 280.45 ▼ 0.76% KIMBER 38.85 ▲ 1.17% SQM-B 65,055 ▲ 0.80% COPEC 6,550 ▲ 1.55% BSANTANDER 79.85 ▲ 1.06% FALABELLA 6,042 ▲ 2.08% ENELAM 84.53 — 0.00% CENCOSUD 2,010 ▼ 0.89% CMPC 1,070 ▼ 1.28% BANCO CHILE 193.50 ▲ 1.84% LATAM AIR 24.09 ▼ 0.45% YPF 82,500 ▲ 2.33% GGAL 8,275 ▲ 3.89% PAMPA 5,625 ▲ 2.74% TXAR 668.50 ▼ 1.55% ALUAR 974.00 ▲ 0.10% TGS 9,905 ▲ 2.01% CEPU 2,411 ▲ 3.03% MIRGOR 16,925 ▲ 0.89% COME 43.14 ▲ 0.63% LOMA NEGRA 3,823 ▲ 6.03% BYMA 295.00 ▲ 0.94% TELECOM ARG 4,420 ▲ 3.88% ECOPETROL 16.69 ▲ 0.97% BANCOLOMBIA 84.66 ▲ 1.22% GRUPO AVAL 5.04 ▼ 0.98% CREDICORP 393.43 ▲ 0.60% SOUTHERN COPPER 195.48 ▲ 3.97% BUENAVENTURA 32.09 ▲ 2.69% MERCADOLIBRE 1,799 ▼ 1.29% NUBANK 14.51 ▲ 0.83% XP 17.30 ▲ 2.67% PAGSEGURO 9.67 ▲ 0.94% STONE 11.36 ▲ 0.93% GLOBANT 30.67 ▼ 4.45% TECNOGLASS 45.24 ▲ 0.20% GAP AIRPORT 217.70 ▲ 0.01% ASUR 273.53 ▼ 0.52% OMA AIRPORT 105.35 ▲ 1.07% AMX ADR 26.12 ▲ 0.12% FEMSA ADR 130.96 ▲ 0.47% CEMEX ADR 12.74 ▲ 0.32% PETROBRAS ADR 18.89 ▲ 1.89% VALE ADR 14.85 ▲ 4.21% ITAU ADR 8.48 ▲ 0.95% SANTANDER BR 5.45 ▲ 0.74% AMBEV ADR 3.14 ▲ 0.96% CSN 1.09 ▲ 9.00% GERDAU 4.77 ▲ 2.69% LATAM ADR 51.22 ▼ 0.68% BTC 65,703 ▼ 0.60% ETH 1,929 ▼ 0.24% SOL 77.56 ▼ 0.44% XRP 1.14 ▼ 0.55% BNB 570.07 ▼ 0.12% ADA 0.17 ▼ 0.18% DOGE 0.07 ▼ 0.77% AVAX 6.58 ▼ 0.56% LINK 8.62 ▼ 0.01% DOT 0.82 ▼ 1.82% LTC 46.91 ▼ 0.34% BCH 215.91 ▼ 1.84% TRX 0.33 ▼ 0.39% XLM 0.18 ▼ 1.24% HBAR 0.07 ▲ 1.90% NEAR 1.88 ▲ 0.38% ATOM 1.48 ▲ 0.51% AAVE 97.25 ▼ 0.11% SELIC 14.25% EMBRAER 83.79 ▲ 1.38% EMBRAER ADR 66.05 ▲ 0.89% JBS 12.25 ▲ 2.51% JBS BDR 61.80 ▲ 2.62% MBRF3 16.03 ▲ 6.09% MBRFY 3.19 ▲ 8.14% INTER 5.69 ▲ 1.97% IBOV 177,547.57 ▲ 2.44% IPSA 11,009.22 ▲ 0.50% IPC MEX 67,298.78 ▲ 0.88% MERVAL 3,379,771 ▲ 2.98% COLCAP 2,297.00 ▼ 0.19% BVL PERÚ 57,575.02 — — USD/BRL 5.06 ▲ 0.05% USD/MXN 17.44 ▲ 0.31% USD/CLP 937.27 ▲ 0.17% USD/COP 3,204 ▼ 0.73% USD/PEN 3.39 ▼ 0.31% USD/ARS 1,482 ▼ 0.03% USD/UYU 40.14 ▲ 1.16% USD/PYG 6,035 ▲ 1.38% USD/BOB 10.95 ▲ 2.82% USD/DOP 57.92 ▼ 0.14% USD/CRC 447.42 ▲ 1.36% USD/GTQ 7.62 ▲ 2.31% USD/HNL 26.74 ▲ 0.88% USD/NIO 36.62 ▲ 0.31% USD/VES 736.04 ▼ 0.13% USD/PAB 1.00 — 0.00% USD/BZD 2.00 — 0.00% USD/JMD 157.49 ▲ 0.36% USD/TTD 6.71 ▲ 0.76% EUR/BRL 5.77 ▼ 0.48% BRENT 86.40 ▼ 8.15% WTI 90.04 ▲ 3.70% IRON ORE 161.91 — — COPPER 6.46 ▲ 0.20% GOLD 4,099 ▼ 1.16% SILVER 59.19 ▼ 1.39% SOY 1,241 ▲ 0.63% CORN 485.75 ▲ 5.14% WHEAT 702.75 ▼ 0.43% COFFEE 301.65 ▼ 4.74% SUGAR 14.81 ▲ 0.47% ORANGE JUICE 147.50 ▲ 2.57% COTTON 81.06 ▲ 1.49% COCOA 5,527 ▲ 3.73% BEEF 219.20 ▼ 3.30% CATTLE 336.15 ▼ 3.83% LITHIUM 69.00 ▼ 0.12% PETR4 42.58 ▲ 2.21% VALE3 75.10 ▲ 3.96% ITUB4 42.90 ▲ 0.87% BBDC4 18.97 ▲ 2.26% ABEV3 16.13 ▲ 2.09% BBAS3 21.09 ▲ 1.01% B3SA3 15.90 ▲ 4.81% WEGE3 46.74 ▲ 10.05% PRIO3 59.77 ▲ 2.73% SUZB3 42.66 ▲ 2.47% RENT3 37.14 ▲ 1.61% AZZA3 17.81 ▲ 1.89% CSAN3 3.92 ▲ 3.70% RAIZ4 0.27 — 0.00% PCAR3 2.75 ▲ 0.73% GMAT3 3.91 ▲ 2.09% PSSA3 55.45 ▲ 3.68% CVCB3 1.27 ▲ 13.39% POSI3 3.70 ▲ 0.54% SLCE3 13.96 ▲ 1.53% NATU3 8.68 ▼ 0.34% BRKM5 6.07 ▲ 6.30% RANI3 8.00 ▲ 1.39% CSNA3 5.38 ▲ 6.32% CMIN3 5.84 ▲ 4.66% USIM5 8.65 ▲ 2.25% GGBR4 24.06 ▲ 2.43% ENEV3 25.97 ▲ 2.16% CPFE3 46.71 ▲ 0.67% CMIG4 11.21 ▲ 1.72% EQTL3 39.35 ▲ 1.34% LREN3 13.54 ▲ 2.03% VIVT3 35.38 ▼ 1.17% RAIL3 13.64 ▲ 3.02% KLABIN 17.93 ▲ 1.93% RAIA DROGASIL 18.29 ▲ 0.88% RDOR3 34.49 ▲ 1.68% HAPV3 11.39 ▲ 1.33% FLRY3 16.65 ▲ 0.60% SMTO3 16.05 ▲ 3.02% UGPA3 32.83 ▲ 3.17% VBBR3 34.98 ▲ 3.03% BBSE3 42.58 ▲ 2.48% BPAC11 57.02 ▲ 2.98% CURY3 30.20 ▲ 0.83% AERI3 2.05 ▲ 0.49% VIVARA 21.55 ▲ 0.65% COMPASS 24.81 ▲ 1.51% VAMOS 3.23 ▲ 4.53% SANB11 26.95 ▼ 0.96% ASAI3 8.40 ▲ 1.82% SBSP3 29.29 ▲ 2.41% WALMEX 48.65 ▼ 1.02% GMEXICO 214.34 ▲ 2.57% FEMSA 227.98 ▲ 0.55% CEMEX 22.17 ▲ 0.45% GFNORTE 191.99 ▲ 3.33% BIMBO 60.30 ▲ 1.53% TELEVISA 9.82 ▲ 0.61% AMX 22.70 ▼ 0.26% GAP 378.40 ▼ 0.03% ASUR 273.53 ▼ 0.52% OMA 229.62 ▲ 1.49% KOF 182.55 ▲ 1.15% GRUMA 280.45 ▼ 0.76% KIMBER 38.85 ▲ 1.17% SQM-B 65,055 ▲ 0.80% COPEC 6,550 ▲ 1.55% BSANTANDER 79.85 ▲ 1.06% FALABELLA 6,042 ▲ 2.08% ENELAM 84.53 — 0.00% CENCOSUD 2,010 ▼ 0.89% CMPC 1,070 ▼ 1.28% BANCO CHILE 193.50 ▲ 1.84% LATAM AIR 24.09 ▼ 0.45% YPF 82,500 ▲ 2.33% GGAL 8,275 ▲ 3.89% PAMPA 5,625 ▲ 2.74% TXAR 668.50 ▼ 1.55% ALUAR 974.00 ▲ 0.10% TGS 9,905 ▲ 2.01% CEPU 2,411 ▲ 3.03% MIRGOR 16,925 ▲ 0.89% COME 43.14 ▲ 0.63% LOMA NEGRA 3,823 ▲ 6.03% BYMA 295.00 ▲ 0.94% TELECOM ARG 4,420 ▲ 3.88% ECOPETROL 16.69 ▲ 0.97% BANCOLOMBIA 84.66 ▲ 1.22% GRUPO AVAL 5.04 ▼ 0.98% CREDICORP 393.43 ▲ 0.60% SOUTHERN COPPER 195.48 ▲ 3.97% BUENAVENTURA 32.09 ▲ 2.69% MERCADOLIBRE 1,799 ▼ 1.29% NUBANK 14.51 ▲ 0.83% XP 17.30 ▲ 2.67% PAGSEGURO 9.67 ▲ 0.94% STONE 11.36 ▲ 0.93% GLOBANT 30.67 ▼ 4.45% TECNOGLASS 45.24 ▲ 0.20% GAP AIRPORT 217.70 ▲ 0.01% ASUR 273.53 ▼ 0.52% OMA AIRPORT 105.35 ▲ 1.07% AMX ADR 26.12 ▲ 0.12% FEMSA ADR 130.96 ▲ 0.47% CEMEX ADR 12.74 ▲ 0.32% PETROBRAS ADR 18.89 ▲ 1.89% VALE ADR 14.85 ▲ 4.21% ITAU ADR 8.48 ▲ 0.95% SANTANDER BR 5.45 ▲ 0.74% AMBEV ADR 3.14 ▲ 0.96% CSN 1.09 ▲ 9.00% GERDAU 4.77 ▲ 2.69% LATAM ADR 51.22 ▼ 0.68% BTC 65,703 ▼ 0.60% ETH 1,929 ▼ 0.24% SOL 77.56 ▼ 0.44% XRP 1.14 ▼ 0.55% BNB 570.07 ▼ 0.12% ADA 0.17 ▼ 0.18% DOGE 0.07 ▼ 0.77% AVAX 6.58 ▼ 0.56% LINK 8.62 ▼ 0.01% DOT 0.82 ▼ 1.82% LTC 46.91 ▼ 0.34% BCH 215.91 ▼ 1.84% TRX 0.33 ▼ 0.39% XLM 0.18 ▼ 1.24% HBAR 0.07 ▲ 1.90% NEAR 1.88 ▲ 0.38% ATOM 1.48 ▲ 0.51% AAVE 97.25 ▼ 0.11% SELIC 14.25% EMBRAER 83.79 ▲ 1.38% EMBRAER ADR 66.05 ▲ 0.89% JBS 12.25 ▲ 2.51% JBS BDR 61.80 ▲ 2.62% MBRF3 16.03 ▲ 6.09% MBRFY 3.19 ▲ 8.14% INTER 5.69 ▲ 1.97%
since 2009
Thursday, July 23, 2026

Copper Retreats from Record Highs as Tariff Concerns Drive Market Volatility

By · March 28, 2025 · 4 min read

Daily Brief

The morning intel from across Latin America. Free.

By subscribing you agree to our privacy policy. We never share your email.

The copper market opened at $5.0455 per pound in early morning trading on March 28, 2025, reflecting a continued pullback from the near-record levels seen earlier this week.

This represents a 3.48% decline from yesterday’s closing price, as traders continue to assess the potential impact of US tariffs and take profits following the recent rally.

Copper prices have retreated from Wednesday’s unprecedented high of $5.3740 per pound ($11,840 per tonne), which marked the metal’s highest level in recent history.

The sharp reversal began during Wednesday’s session when prices topped at $5.374 before reversing intraday to close at $5.243, forming what technical analysts describe as a candle with a long upward pointing shadow – typically a warning sign of excessive buying pressure meeting significant resistance.

Yesterday (March 27), this downward momentum continued with copper trading at $5.2275 per pound in early morning, representing a 0.29% decline from the previous day’s close.

The London Metal Exchange (LME) three-month copper contract settled at $9,787.00 per tonne, down from the previous day’s $9,847.00. Overnight trading saw continued profit-taking, bringing us to the current level of $5.0455, though copper still maintains approximately a 27% gain year-to-date.

Global Market Performance

London Metal Exchange (LME): The benchmark three-month copper contract on the LME closed at $9,787.00 yesterday, down from $9,884.00 on March 26, continuing a downward trend after peaking earlier in the week.
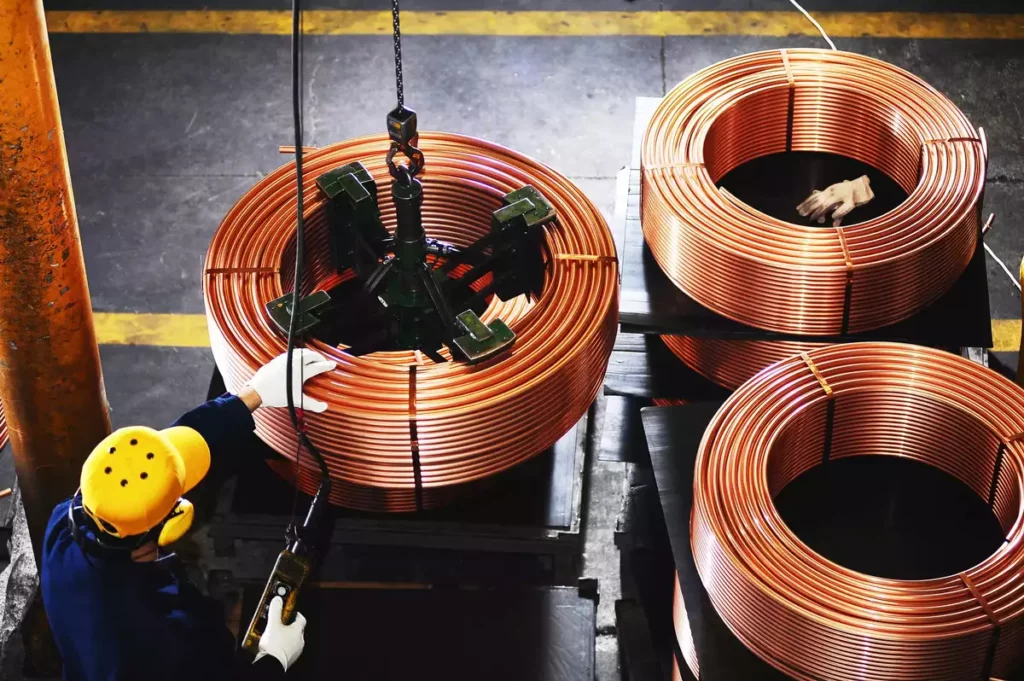
Copper Retreats from Record Highs as Tariff Concerns Drive Market Volatility
Copper Retreats from Record Highs as Tariff Concerns Drive Market Volatility. (Photo Internet reproduction)
One-stop reference
Company Intelligence
Every listed company in Latin America — financials, ownership and structure for 1,450+ companies across 26 exchanges, in one place.
Browse the directory →

LME copper stocks currently stand at around 224,600 tonnes based on recent reports, showing a slight decrease from previous weeks.

COMEX (US): The premium between prices on New York’s Comex and the LME remains elevated at nearly 12%, creating significant incentives for traders to move copper to the US ahead of potential tariffs. This premium approached record highs reached in mid-February, reflecting ongoing supply concerns in the US market.

Shanghai Futures Exchange: The April copper contract was recently trading in backwardation (near-term prices higher than future prices), signaling near-term supply tightness in the Chinese market. Earlier this week, the contract was reported at 81,900 yuan ($11,277.88) per tonne.

Market Drivers

The primary catalyst for copper’s recent volatility remains concern over potential US tariffs. Market speculation has intensified that the Trump administration will implement copper import tariffs in weeks rather than months, with many analysts projecting tariffs of up to 25%.

“Everyone sees demand for copper as very strong and they all ask for more copper,” Maximo Pacheco, chairman of Chilean state-run producer Codelco, stated in a recent interview, noting increased inquiries from US customers amid tariff concerns.

The differential between US and global copper prices has created significant arbitrage opportunities, with Goldman Sachs and Citigroup both anticipating 25% import levies on copper by year-end. This expectation is driving US buyers to secure supplies in advance of any tariff implementation.

Natalie Scott-Gray, senior metals demand analyst at StoneX, noted earlier this week that copper’s rise is being driven “solely by supply concerns surrounding the potential for universal tariffs to be placed on all imports of copper into the US,” highlighting that the US is “heavily reliant on foreign copper, with imports accounting for around 45% of demand”.

Technical Analysis

Copper’s technical indicators present a mixed picture following this week’s volatility. Prior to the pullback, moving averages showed a bullish trend with all key periods (5, 10, 20, and 50-day) indicating upward momentum. The RSI (Relative Strength Index) stood at 61.86, still in bullish territory but pulling back from overbought conditions.

The price action on March 26-27 created what technical analysts identify as a potential reversal signal, with the long upward shadow on Wednesday followed by a supply-side controlled candle on Thursday.

This pattern suggests the market has likely reached at least a temporary equilibrium point, though it doesn’t necessarily indicate a definitive top.

Key support levels to watch include the short-term uptrend around $5.00 and the static demand zone at $4.906-5.027. A break below these levels could signal a more significant correction, potentially similar to the reversal seen in May-June last year.

Fundamental Outlook

Despite the short-term pullback, copper‘s longer-term fundamentals remain strong. The global push toward electrification continues to drive unprecedented demand for copper, with electric vehicles requiring 2-4 times more copper than traditional vehicles (approximately 83kg versus 23kg).

Supply constraints persist in major copper-producing regions, with Chile and Peru experiencing various disruptions ranging from labor disputes to adverse weather conditions.

New mine development has stagnated, with the average lead time from discovery to production exceeding 15 years, creating a substantial lag between rising demand and new supply.

American buyers are actively looking to source more copper from countries like Chile and Peru amid the broader buildup of stockpiles, while some metal from Mexican and Canadian mines may be diverted to Europe following Trump’s sweeping tariffs on key US trading partners.

Conclusion

The copper market appears to be in a period of consolidation following this week’s exceptional volatility. While prices have retreated from record highs, the fundamental supply-demand imbalance and ongoing concerns about US tariffs continue to provide support.

Traders should monitor key technical levels and policy developments closely in the coming days as the market digests recent gains and adjusts to evolving trade dynamics.

Even with the current pullback, copper has increased approximately 27.36% since the beginning of 2025, highlighting the metal’s strong performance amid global economic shifts and policy uncertainties.

Live Market IntelligenceCommodities — Live Market BoardInside: market breadth, the sector heatmap, currencies & rates, the Latin America scoreboard and the full instrument board.

Rio Times · Live Market Intelligence

Commodities — Live Market Board

Global
Jul 23, 2026 · 06:31

Brent crude · benchmark
86.40
-8.15%
L 85.01day rangeH 86.47

+26.11% over 12 months

Market breadth · 15 names
53% advancing

8 ▲ advancing7 declining ▼

Currencies, rates & key inputs
Gold
4,099
-1.16%

Silver
59.19
-1.39%

Copper
6.46
+0.20%

Iron ore
161.91
·

WTI crude
90.04
+3.70%

Full instrument board
Instrument Last Change YoY Prev. High Low Volume
GOLD 4,099 -1.16% +20.77% 4,147 4,144 4,075 42,449
SILVER 59.19 -1.39% +50.68% 60.02 60.36 58.91 8,606
BRENT 86.40 -8.15% +26.11% 94.07 86.47 85.01 14,672
WTI 90.04 +3.70% +37.99% 86.83 90.07 87.32 81,449
COPPER 6.46 +0.20% +11.54% 6.45 6.54 6.44 8,536
LITHIUM 69.00 -0.12% +58.73% 69.08 69.65 68.95 261,058
IRON ORE 161.91 +64.76% 161.91 161.91 1
SOY 1,241 +0.63% +23.37% 1,233 1,245 1,236 19,579
CORN 485.75 +5.14% +21.89% 462.00 487.50 483.00 33,070
WHEAT 702.75 -0.43% +30.02% 705.75 710.00 698.25 12,025
COFFEE 301.65 -4.74% +0.10% 316.65 307.70 300.95 397
SUGAR 14.81 +0.47% -8.81% 14.74 14.86 14.73 5,810
COCOA 5,527 +3.73% -34.51% 5,328 5,540 5,333 1,041
ORANGE JUICE 147.50 +2.57% -56.17% 143.80 150.50 140.55
COTTON 81.06 +1.49% +21.68% 79.87 81.75 79.75 12,672
BEEF 219.20 -3.30% -3.45% 226.68 222.55 218.83 22,518
CATTLE 336.15 -3.83% +1.40% 349.55 344.00 335.00 11,864
USD/BRL 5.06 +0.05% -9.11% 5.05 5.06 5.04

Largest moves today
BRENT
86.40
-8.15%
CORN
485.75
+5.14%
COFFEE
301.65
-4.74%
CATTLE
336.15
-3.83%
COCOA
5,527
+3.73%
WTI
90.04
+3.70%
BEEF
219.20
-3.30%
ORANGE JUICE
147.50
+2.57%

The session read
The Brent crude eased 8.15%, with breadth positive — 8 of 15 names higher. CORN led, while COFFEE lagged.

LatAm Markets: Live Signals → — real-time movers, turnover leaders and FX across Latin America.

Read More from The Rio Times

The Rio Times · Power Map
See who really holds power in Latin America
Click to open the Power Map

Rotate for Best Experience

This report is optimized for landscape viewing. Rotate your phone for the full experience.