US 10-Year Yield Tops 5% as Gold Drops 2.5% | Global Economy, Nov 13
Rio Times Global Economy Briefing
The Big Three
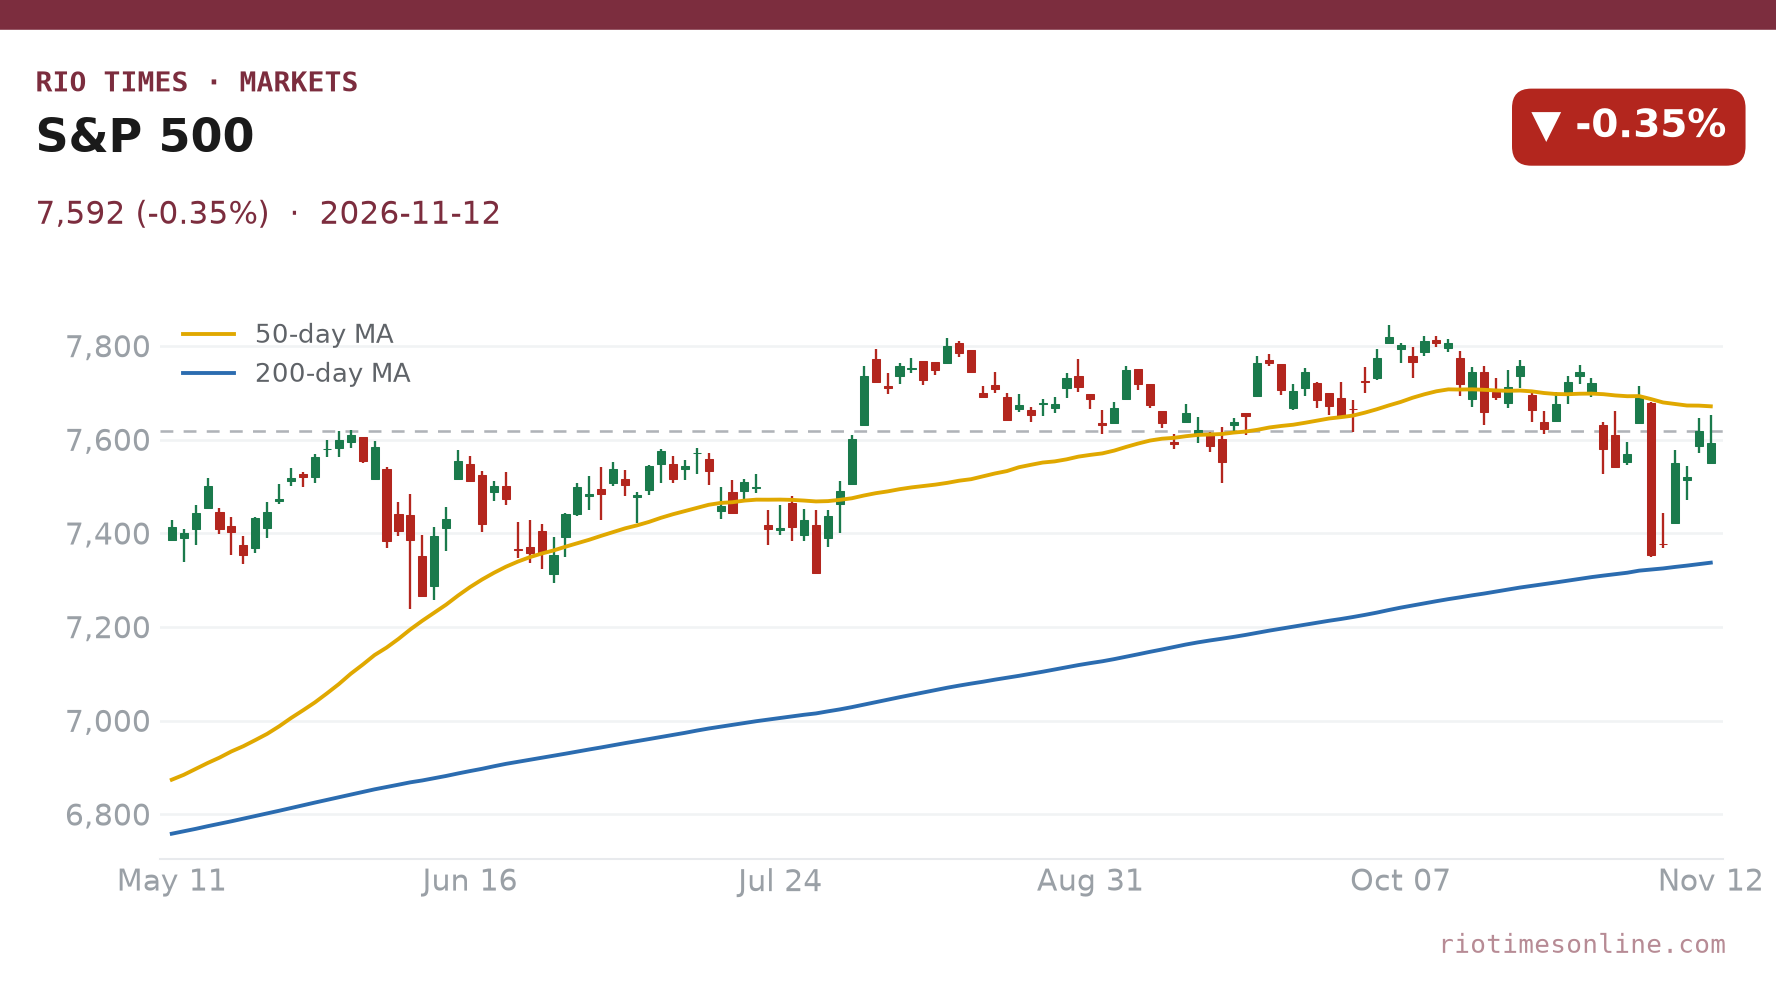
- Treasury yields push through 5% The US 10-year yield stands at 5.134% (+2.68%) and the S&P 500 sits at 7,592 (-0.35%). Rate-hike bets, not growth fears, are driving the move.
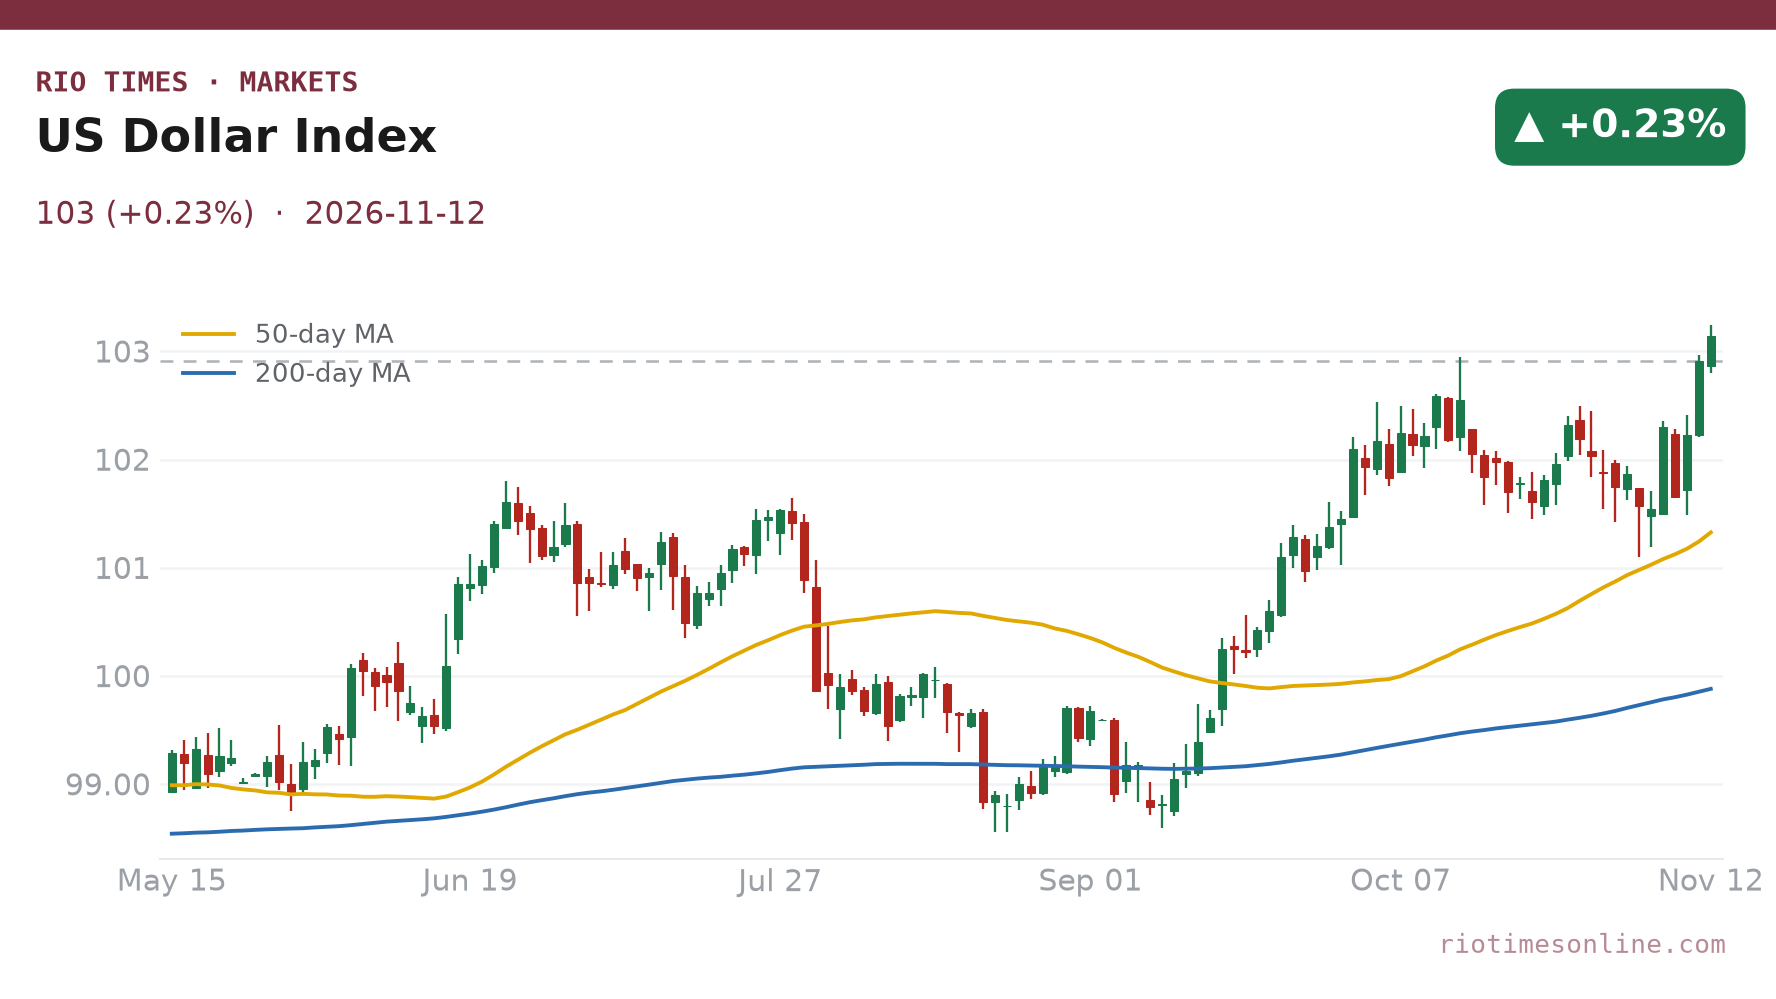
- Gold drops 2.46% to $3,881/oz A firmer dollar (DXY 103.146, +0.23%) and higher yields make the metal costlier to hold. It is another hard fall in a week of sharp swings.
- Brazil’s inflation cools, but the Fed sets the tone October IPCA slowed to 0.14% on the month, while the 12-month rate edged up to 4.63%. Even so, a 5.134% US yield limits how far Brazil’s central bank can ease.
United States
| Indicator | Actual | Prior | Verdict |
|---|---|---|---|
| Non-farm payrolls (Oct) | 165,000 | n/a (forecast 65,000) | Huge beat; fuels hike bets |
| Unemployment rate (Oct) | 4.1% | n/a | Labour market tightens |
| EIA commercial crude stocks (wk to 6 Nov) | 414.4m bbl (+4.7m) | 409.7m bbl | Build; soft for oil |
| EIA gasoline stocks | 210.8m bbl (+1.8m) | 209.0m bbl | Build |
| EIA distillate stocks | 103.3m bbl (+4.1m) | 99.2m bbl | Large build |
| PPI m/m (Oct), 13:30 Lisbon | Due (forecast 0.4%) | 1.3% | Key test for the 5% yield |
| Core PPI m/m, 13:30 Lisbon | Due (forecast 0.3%) | 0.7% | Watch for cooling |
| PPI y/y, 13:30 Lisbon | Due (forecast 6.6%) | 6.3% | Forecast to accelerate |
Europe & United Kingdom
| Indicator | Actual | Prior | Verdict |
|---|---|---|---|
| UK GDP Q3 q/q | 0.7% | 0.5% | In line; firmer than before |
| UK GDP Sep m/m | 0.2% | 0.0% | Beat (forecast 0.0%) |
| UK industrial production Sep m/m | 0.3% | 0.7% | Beat (forecast -0.3%) |
| UK manufacturing output Sep m/m | 0.7% | 0.7% | Beat (forecast -0.5%) |
| UK business investment Q3 q/q | 0.4% | 1.8% | Beat (forecast -0.2%) |
| UK goods trade balance Sep | -22.29 | -19.61 | Wider gap than forecast (-19.2) |
| UK RICS house price balance Oct | -36 | -34 | Weaker; housing still soft |
| German wholesale prices y/y (07:00 Lisbon) | Forecast 9.1% | 8.7% | Price pressure still rising |
Asia-Pacific & Emerging Markets
| Indicator | Actual | Prior | Verdict |
|---|---|---|---|
| Brazil IPCA Oct m/m | 0.14% | 0.82% | Sharp slowdown |
| Brazil IPCA Oct y/y | 4.63% | 4.58% | Edged up |
| Japan 5-year JGB auction yield | 2.186% | 2.379% | Lower than last auction |
| China total social financing (09:00 Lisbon) | Forecast 1,420 | 3,550 | Sharp drop expected |
| China M2 money supply y/y | Forecast 7.2% | 7.2% | Steady |
| Brazil retail sales (12:00 Lisbon) | Forecast 1.0% | 0.4% | Consumer test |
| Brazil business confidence (14:00 Lisbon) | Forecast 46.5 | 46.2 | Marginal improvement |
| Colombia retail sales (15:00 Lisbon) | Forecast 8.7% | 7.3% | Strong demand expected |
| Colombia industrial production (15:00 Lisbon) | Forecast -0.8% | -3.7% | Smaller contraction expected |
| Instrument | Level | Session |
|---|---|---|
| S&P 500 (US) | 7,592 | -0.35% |
| Ibovespa (Brazil) | 171,324 | -0.43% |
| USD/BRL | 5.6413 | +1.05% |
Source: market close, 12 November 2026.
Today’s Economic Calendar — Friday, November 13, 2026
| Time | Country | Event | Consensus | Prior |
|---|---|---|---|---|
| 02:00 | JP | Thomson Reuters IPSOS PCSI | — | 38.96 |
| 02:00 | CN | Thomson Reuters IPSOS PCSI | — | 69.29 |
| 03:35 | JP | 3-Month Bill Auction | — | 1.241 |
| 07:00 | DE | Wholesale Prices | 9.1 | 8.7 |
| 07:00 | DE | Wholesale Prices | 0.4 | 1.9 |
| 09:00 | CN | Current Account | 200.5 | 193.7 |
| 09:00 | CN | Outstanding Loan Growth | 4.8 | 4.8 |
| 09:00 | CN | M2 Money Supply | 7.2 | 7.2 |
| 09:00 | CN | Total Social Financing | 1420 | 3550 |
| 09:00 | CN | New Loans | 20 | 1080 |
| 12:00 | BR | Retail Sales | 1 | 0.4 |
| 12:00 | BR | Retail Sales | -0.2 | 0.1 |
| 13:30 | US | Core PPI | 0.3 | 0.7 |
| 13:30 | US | Core PPI | 5 | 5 |
| 13:30 | US | PPI Ex Food, Energy and Trade | 0.3 | 0.5 |
| 13:30 | US | PPI Ex Food, Energy and Trade | 5 | 5 |
| 13:30 | US | Producer Price Index | 0.4 | 1.3 |
| 13:30 | US | Producer Price Index | 6.6 | 6.3 |
01 The bond market flinches, and shares follow
Wall Street is giving back a little after Wednesday’s rally. The S&P 500 sits at 7,592 (-0.35%), the Dow at 52,297 (-0.36%) and the Nasdaq at 25,366 (-0.39%).
The falls are small, but the mood is nervous. The VIX, Wall Street’s fear gauge, is at 18.7 (+6.92%) as investors pay more for protection after a week of violent swings.
The cause is the bond market. The US 10-year Treasury yield is 5.134% (+2.68%), and a yield that high makes future company profits worth less today.
Gold has lost its shine as a result. The spot price is $3,881/oz (-2.46%), another hard fall this week, because the metal pays no interest while Treasuries now pay over 5%.
The dollar adds to the pressure. The dollar index is at 103.146 (+0.23%), which makes gold and other dollar-priced assets dearer for buyers elsewhere.
02 A hot jobs market and a hawkish Fed
The labour market is why the Fed cannot relax. October payrolls rose 165,000 against a forecast of 65,000, and unemployment fell to 4.1%.
Traders have since begun to bet on a Fed rate rise rather than a cut. That sharp turn explains why the 10-year yield has pushed above 5%.
Weekly jobless claims rose to 200,000 in the week to 7 November against 195,000 expected, and continuing claims fell to 1.697 million in the week to 31 October, according to the US Labor Department’s series. Producer prices are the next test.
The US PPI arrives at 13:30 Lisbon (08:30 New York), with forecasts of 0.4% on the month after 1.3% last time, and 6.6% on the year after 6.3%. Core PPI, which strips out food, energy and trade, is forecast at 0.3% after 0.7%.
A figure above forecast would harden the case for a rate rise. Fed officials then take the stage.
Collins speaks at 14:10 Lisbon and Bowman at 15:50, with Jefferson just after midnight.
Live Market IntelligenceGlobal Markets — Live Board
Rio Times · Live Market Intelligence
Global Markets — Live Board
-0.35%
| Instrument | Last | Change | YoY | Prev. | High | Low | Volume |
|---|---|---|---|---|---|---|---|
| SPX | 7,592 | -0.35% | — | — | — | — | — |
| NDX | 28,289 | -0.30% | — | — | — | — | — |
| DJI | 52,297 | -0.36% | — | — | — | — | — |
| RUT | 2,799 | -1.66% | — | — | — | — | — |
| US10Y | 5.1030 | +2.10% | — | — | — | — | — |
| VIX | 18.70 | +6.92% | — | — | — | — | — |
| DAX | 26,772 | +0.41% | — | — | — | — | — |
| FTSE | 10,863 | +0.25% | — | — | — | — | — |
| CAC | 8,361 | +0.34% | — | — | — | — | — |
| STOXX | 664.01 | +0.14% | — | — | — | — | — |
| NIKKEI | 61,339 | +0.85% | — | — | — | — | — |
| HSI | 23,786 | -2.18% | — | — | — | — | — |
| KOSPI | 5,310 | -0.62% | — | — | — | — | — |
| CSI300 | 4,042 | -0.05% | — | — | — | — | — |
| NIFTY | 25,215 | -0.33% | — | — | — | — | — |
| TSX | 36,137 | -0.75% | — | — | — | — | — |
| GOLD | 3,912 | +0.69% | -7.16% | 3,885 | 3,927 | 3,879 | 29,811 |
| SILVER | 50.16 | +0.38% | -5.95% | 49.97 | 50.73 | 49.87 | 7,275 |
03 Brazil feels the squeeze from Washington
Brazil received a friendlier inflation print than the US did. Official October IPCA, reported by the statistics agency IBGE on Thursday, rose 0.14% on the month, after 0.82% in September.
The annual rate is what counts for policy. It edged up to 4.63% from 4.58% in September, still above the 4.5% upper limit of the central bank’s tolerance band.
Brazil’s central bank held the Selic at 13.75% on 4 November, ending five straight cuts, according to its own statement. With the US 10-year above 5% and the dollar index at 103.146, a pause is the comfortable option.
The real is the shock absorber. When US yields rise, investors demand more to hold Brazilian assets, and the currency usually weakens, which feeds back into import prices.
Brazil’s own data follow today. Retail sales are due at 12:00 Lisbon (09:00 Brasília) and business confidence at 14:00, forecast at 46.5 against 46.2.
Colombia reports retail sales and industrial production at 15:00 Lisbon (10:00 Bogotá). Forecasts are 8.7% and -0.8%, against 7.3% and -3.7% before.
Oil is a second pressure point for Latin America’s exporters. The US Energy Information Administration (eia.gov/petroleum/supply/weekly) reports commercial crude stocks at 414.4 million barrels for the week to 6 November, up 4.7 million.
Gasoline stocks rose 1.8 million barrels to 210.8 million, and distillates rose 4.1 million to 103.3 million. Builds like these weigh on crude.
In Europe, the UK economy grew 0.7% in the third quarter, matching forecasts and beating the 0.5% before. The goods trade gap widened sharply to £22.29 billion (about US$29.5 billion) from £19.61 billion (about US$25.9 billion), which tempers the good news.
The three-month average growth rate was 0.7%, up from 0.6%. Japan sold five-year bonds at 2.186%, below the 2.379% of the previous auction.
In China, total social financing is forecast at 1,420 against 3,550 before, a drop that would signal weak credit demand.
What to watch today and this week
- Friday 13:30 Lisbon: US PPI and core PPI; forecasts 0.4% and 0.3% on the month, after 1.3% and 0.7%
- Friday afternoon: Fed speakers Collins (14:10) and Bowman (15:50); Brazil retail sales and business confidence; Colombia retail sales
- Saturday 00:00 Lisbon: Fed’s Jefferson speaks; a hawkish tone would extend the move in yields
- Ongoing: Whether the 10-year yield holds above 5%, the Fed rate-hike debate, and the Brazilian real as US yields rise
Frequently Asked Questions
Why are US Treasury yields above 5%?
Strong October payrolls of 165,000, against a forecast of 65,000, pushed traders to bet on a Fed rate rise. The 10-year yield is now 5.134%.
Why is gold falling?
Gold pays no interest, so higher Treasury yields and a firmer dollar make it less attractive. Spot gold is $3,881/oz, down 2.46%.
What does the US producer price index show?
It measures the prices firms receive for goods and services, and often leads consumer inflation. Today’s forecast is 0.4% on the month and 6.6% on the year.
How does this affect Brazil?
Higher US yields and a stronger dollar pressure the real and limit how far the Selic can fall. October inflation of 4.63% over 12 months is still above the central bank’s 4.5% tolerance limit, and the Fed still sets the backdrop.
Where did the oil figures come from?
They come from the US Energy Information Administration’s weekly report at eia.gov. Commercial crude stocks rose 4.7 million barrels to 414.4 million.
This article was produced by The Rio Times’ automated AI newsroom. Editorial responsibility: Matthias Camenzind, Publisher and Editor-in-Chief. The Rio Times also runs Ask Rio Times, which answers from 100,000+ of our own articles, the daily Latin America Power Map, and prediction-market odds on elections and markets.. How we use AI · Report an error
LatAm Markets: Live Signals → — real-time movers, turnover leaders and FX across Latin America.