China’s copper industry continues to exert a significant influence on the global market. Recent data reveals a complex interplay of production increases, export surges, and economic policies.
These factors are reshaping the copper landscape worldwide. Chinese copper smelters have maintained near-record production levels despite raw material shortages.
This defies earlier pledges to reduce capacity due to collapsed processing fees. The industry’s resilience stems from increased scrap metal availability, unlocked by higher prices.
Scrap copper has become a crucial substitute for imported ore. Fabricators convert discarded materials into blister, a semi-processed form. This process helps smelters maintain output despite the global squeeze on raw copper.
The abundance of scrap is evident in its widening discount to refined copper. In May 2024, this discount reached 4,615 yuan ($637) per ton, an eight-year high.
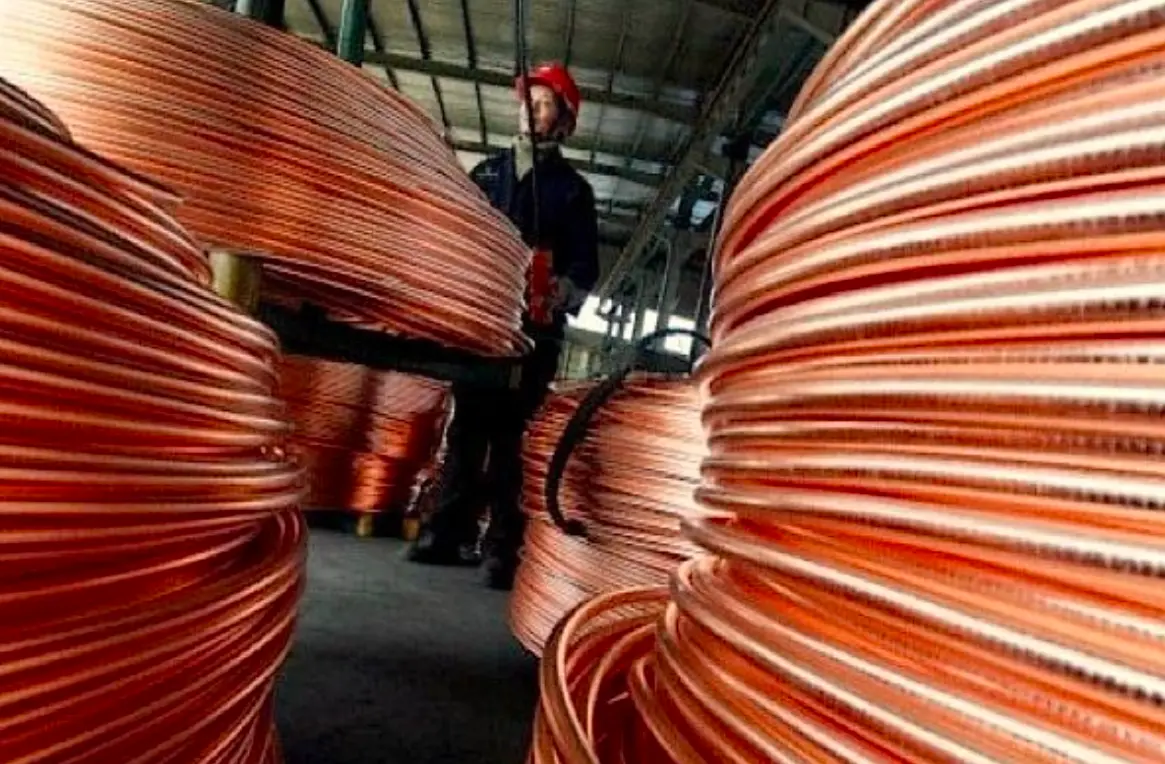
This price gap underscores the current oversupply in China’s domestic market. Chinese copper exports have also seen a dramatic increase.
In May 2024, exports of unwrought copper and related products doubled compared to the previous year. This surge has added pressure to global copper prices, which had reached record highs.
Copper Market Dynamics
The copper price peaked at $5.10 per pound in late May 2024. This rise was driven by growing demand for electric vehicles, AI data centers, and power grid upgrades.
However, China’s export surge has since applied downward pressure on these prices. China’s economic policies play a crucial role in these market dynamics.
Domestic deflation has pushed Chinese producers to seek higher prices in international markets. This strategy effectively exports deflation through copper, similar to China‘s approach in the solar panel market.
Despite these challenges, global copper demand continues to grow. Analysts project a 75% increase in demand by 2050, reaching 56 million tonnes. This growth is largely driven by the energy transition and electrification trends.
The copper industry faces a delicate balance. While demand is rising, oversupply from China complicates market dynamics. This situation creates uncertainty for producers, consumers, and investors in the copper market.
Global copper production is expected to grow by 3.2% in 2024. Key expansions in Chile, the Democratic Republic of Congo, and other major producing countries drive this increase.
However, China’s production and export policies remain central to market outcomes. The copper market’s future hinges on several factors.
These include China’s economic policies, global demand for green technologies, and potential supply adjustments. Market participants are closely monitoring these elements to navigate the evolving landscape.
Live Market IntelligenceCommodities — Live Market Board
Rio Times · Live Market Intelligence
Commodities — Live Market Board
+2.59%
| Instrument | Last | Change | YoY | Prev. | High | Low | Volume |
|---|---|---|---|---|---|---|---|
| GOLD | 4,007 | -0.58% | -2.66% | 4,030 | 4,075 | 4,006 | 96,686 |
| SILVER | 52.04 | +1.84% | +2.81% | 51.10 | 53.18 | 51.42 | 34,746 |
| BRENT | 93.86 | +2.59% | +44.05% | 91.49 | 94.73 | 91.48 | 17,624 |
| WTI | 88.04 | +2.32% | +44.23% | 86.04 | 88.74 | 85.81 | 126,585 |
| COPPER | 6.30 | +1.22% | +24.70% | 6.22 | 6.33 | 6.26 | 24,808 |
| LITHIUM | 61.30 | +2.20% | -0.78% | 59.98 | 61.42 | 60.77 | 69,425 |
| IRON ORE | 161.91 | — | +56.34% | 161.91 | 161.91 | 1 | |
| SOY | 1,232 | +0.57% | +10.62% | 1,225 | 1,233 | 1,219 | 88,873 |
| CORN | 446.50 | -0.56% | +3.36% | 449.00 | 450.75 | 443.25 | 133,688 |
| WHEAT | 598.25 | +0.93% | +11.61% | 592.75 | 603.75 | 589.50 | 79,736 |
| COFFEE | 265.50 | -2.17% | -37.19% | 271.40 | 267.40 | 262.15 | 21,214 |
| SUGAR | 18.48 | +2.16% | +29.68% | 18.09 | 18.57 | 18.10 | 51,339 |
| COCOA | 5,039 | +6.26% | -13.55% | 4,742 | 5,084 | 4,807 | 22,743 |
| ORANGE JUICE | 145.00 | -1.19% | -17.89% | 146.75 | 146.95 | 142.35 | 383 |
| COTTON | 82.35 | +4.65% | +28.91% | 78.69 | 79.90 | 78.63 | 21,034 |
| BEEF | 218.58 | -0.29% | -3.80% | 219.20 | 219.73 | 217.38 | 15,877 |
| CATTLE | 328.48 | -0.57% | -2.72% | 330.35 | 334.33 | 329.50 | 6,181 |
| USD/BRL | 5.56 | -0.36% | +5.14% | 5.58 | 5.59 | 5.55 | — |
This article was produced by The Rio Times’ automated AI newsroom. Editorial responsibility: Matthias Camenzind, Publisher and Editor-in-Chief. The Rio Times also runs Ask Rio Times, which answers from 100,000+ of our own articles, the daily Latin America Power Map, and prediction-market odds on elections and markets.. How we use AI · Report an error
LatAm Markets: Live Signals → — real-time movers, turnover leaders and FX across Latin America.