Rio Times Markets · Chile
Key Facts
- What. Chile’s factory output rose 2.0% in September 2026 from a year earlier, after a 2.6% fall in August.
- Versus forecast. Economists expected 3%. Total industrial output fell 2.7% against a forecast rise of 1.9%.
- The trend. Total industrial output is still shrinking, but the fall eased from 5.7% in August.
- Why. A 12.5% jump in drinks production helped factories, while mining output fell 8.7%.
- What would end it. Total output back above zero in October would end the contraction.
- Power Index. Chile ranks 3rd of 14 in The Rio Times Latin America Power Index, with 63.6 points (October 2026 edition).
Chile’s factories grew again in September, but a slump in copper-led mining kept the country’s overall industrial output in decline.
Factories Recover, Mining Drags
Chile’s national statistics institute, INE, said manufacturing production rose 2.0% in the 12 months to September 2026. That reverses a 2.6% fall in August, but it missed the 3% forecast of economists in the RT economic calendar.
The broader industrial production index, which adds mining and utilities to manufacturing, fell 2.7% over the same period. Economists had expected a rise of 1.9%, so the miss was 4.6 percentage points.
Where the Trend Stands
The decline in total output narrowed from 5.7% in August, so the direction is better even though the level is not. Factories moved from a 2.6% fall to a 2.0% rise, a swing of 4.6 percentage points.
In plain English: industrial production measures what Chile’s mines, factories and power plants make, compared with the same month a year earlier. A negative number means they made less than a year ago.
Why It Moved
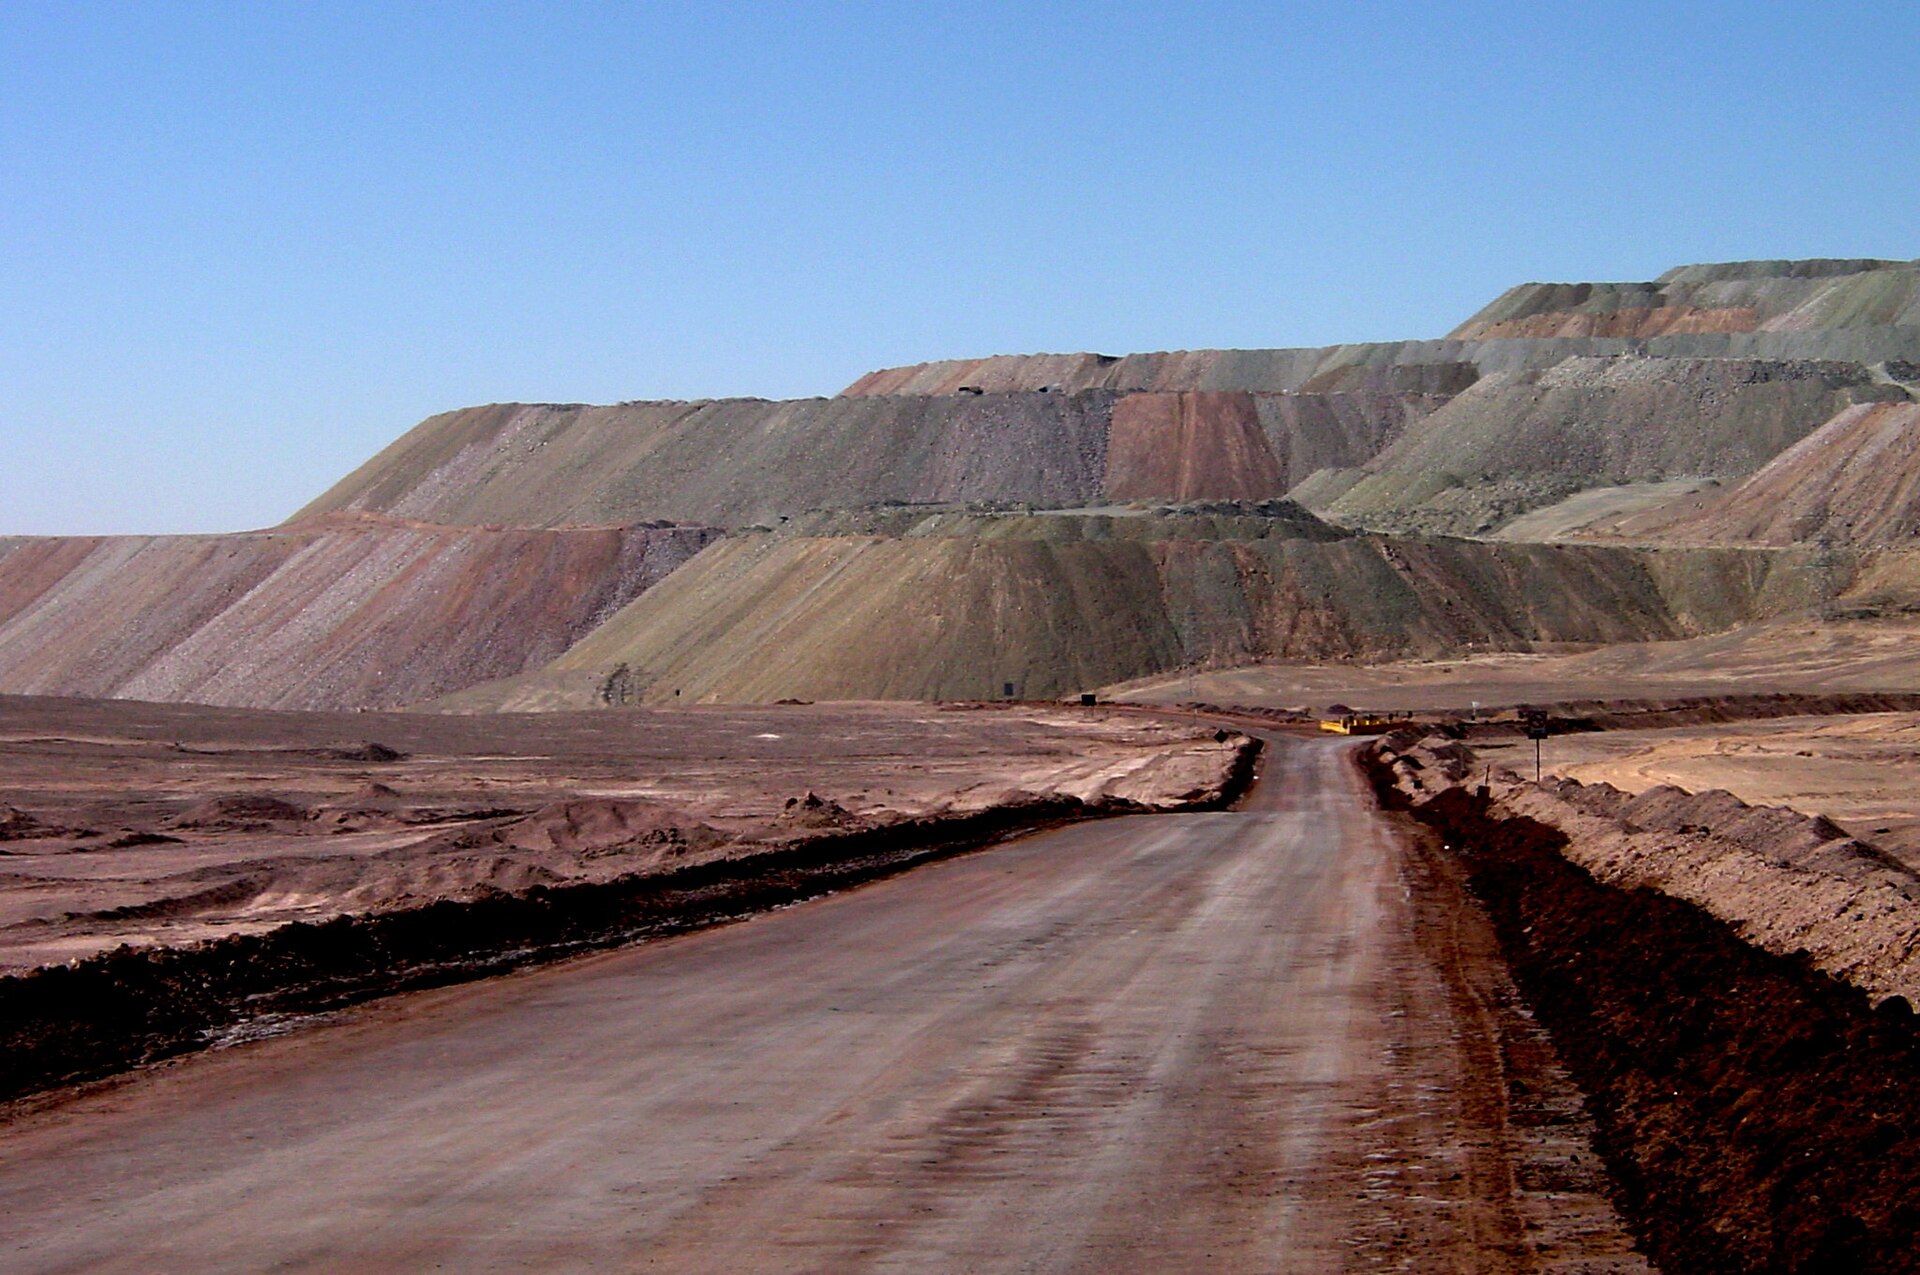
INE said drinks production, alcoholic and non-alcoholic, rose 12.5% and was the main driver of the factory gain. Mining output fell 8.7%, with metal mining down 12%.
Electricity, gas and water production grew 0.8%, which was too small to offset the fall in mining. Manufacturing’s 2.0% gain was also smaller than mining’s 8.7% drop.
What It Means for Readers Abroad
Chile is the world’s largest copper producer, so weak mining output matters for buyers of the metal in the United States and elsewhere. A single month does not set a trend, but a fall of this size in mining is worth watching.
Chile’s factories are recovering even as mining falls. That points to firmer manufacturing than the headline figure suggests.
What Would Change the Picture
Total industrial output rising above zero in the October data would end the contraction and show mining stabilising. Manufacturing slipping back below zero would suggest September’s gain was a one-off.
What Is Not Known Yet
It is not yet known whether the drinks surge will last or was a temporary jump. It is also unclear how much of the mining fall is temporary.
Sources: Instituto Nacional de Estadísticas (INE) industrial production release of 30 October 2026; RT economic calendar for forecasts and earlier values. This is news, not investment advice.
Frequently Asked Questions
How much did Chile’s manufacturing output rise in September 2026?
Manufacturing production rose 2.0% from a year earlier, INE reported on 30 October 2026. Economists had forecast 3%.
Why did Chile’s total industrial output fall 2.7%?
Mining output fell 8.7%, with metal mining down 12%. Manufacturing (+2.0%) and utilities (+0.8%) were too small to offset it.
What is Chile’s industrial production index?
It measures the monthly output of Chile’s mining, manufacturing and utility sectors against the same month a year earlier. INE, the national statistics institute, publishes it.
What would show a recovery in Chile’s industry?
Total industrial output rising above zero in the October data would end the contraction. A manufacturing reading below zero would point the other way.
This article was produced by The Rio Times’ automated newsroom system. How we use AI · Report an error · Editorial responsibility: Matthias Camenzind, Editor-in-Chief
In depth
LatAm Markets: Live Signals → — real-time movers, turnover leaders and FX across Latin America.