Chile Copper Production Fell 9.4% in July After Storms
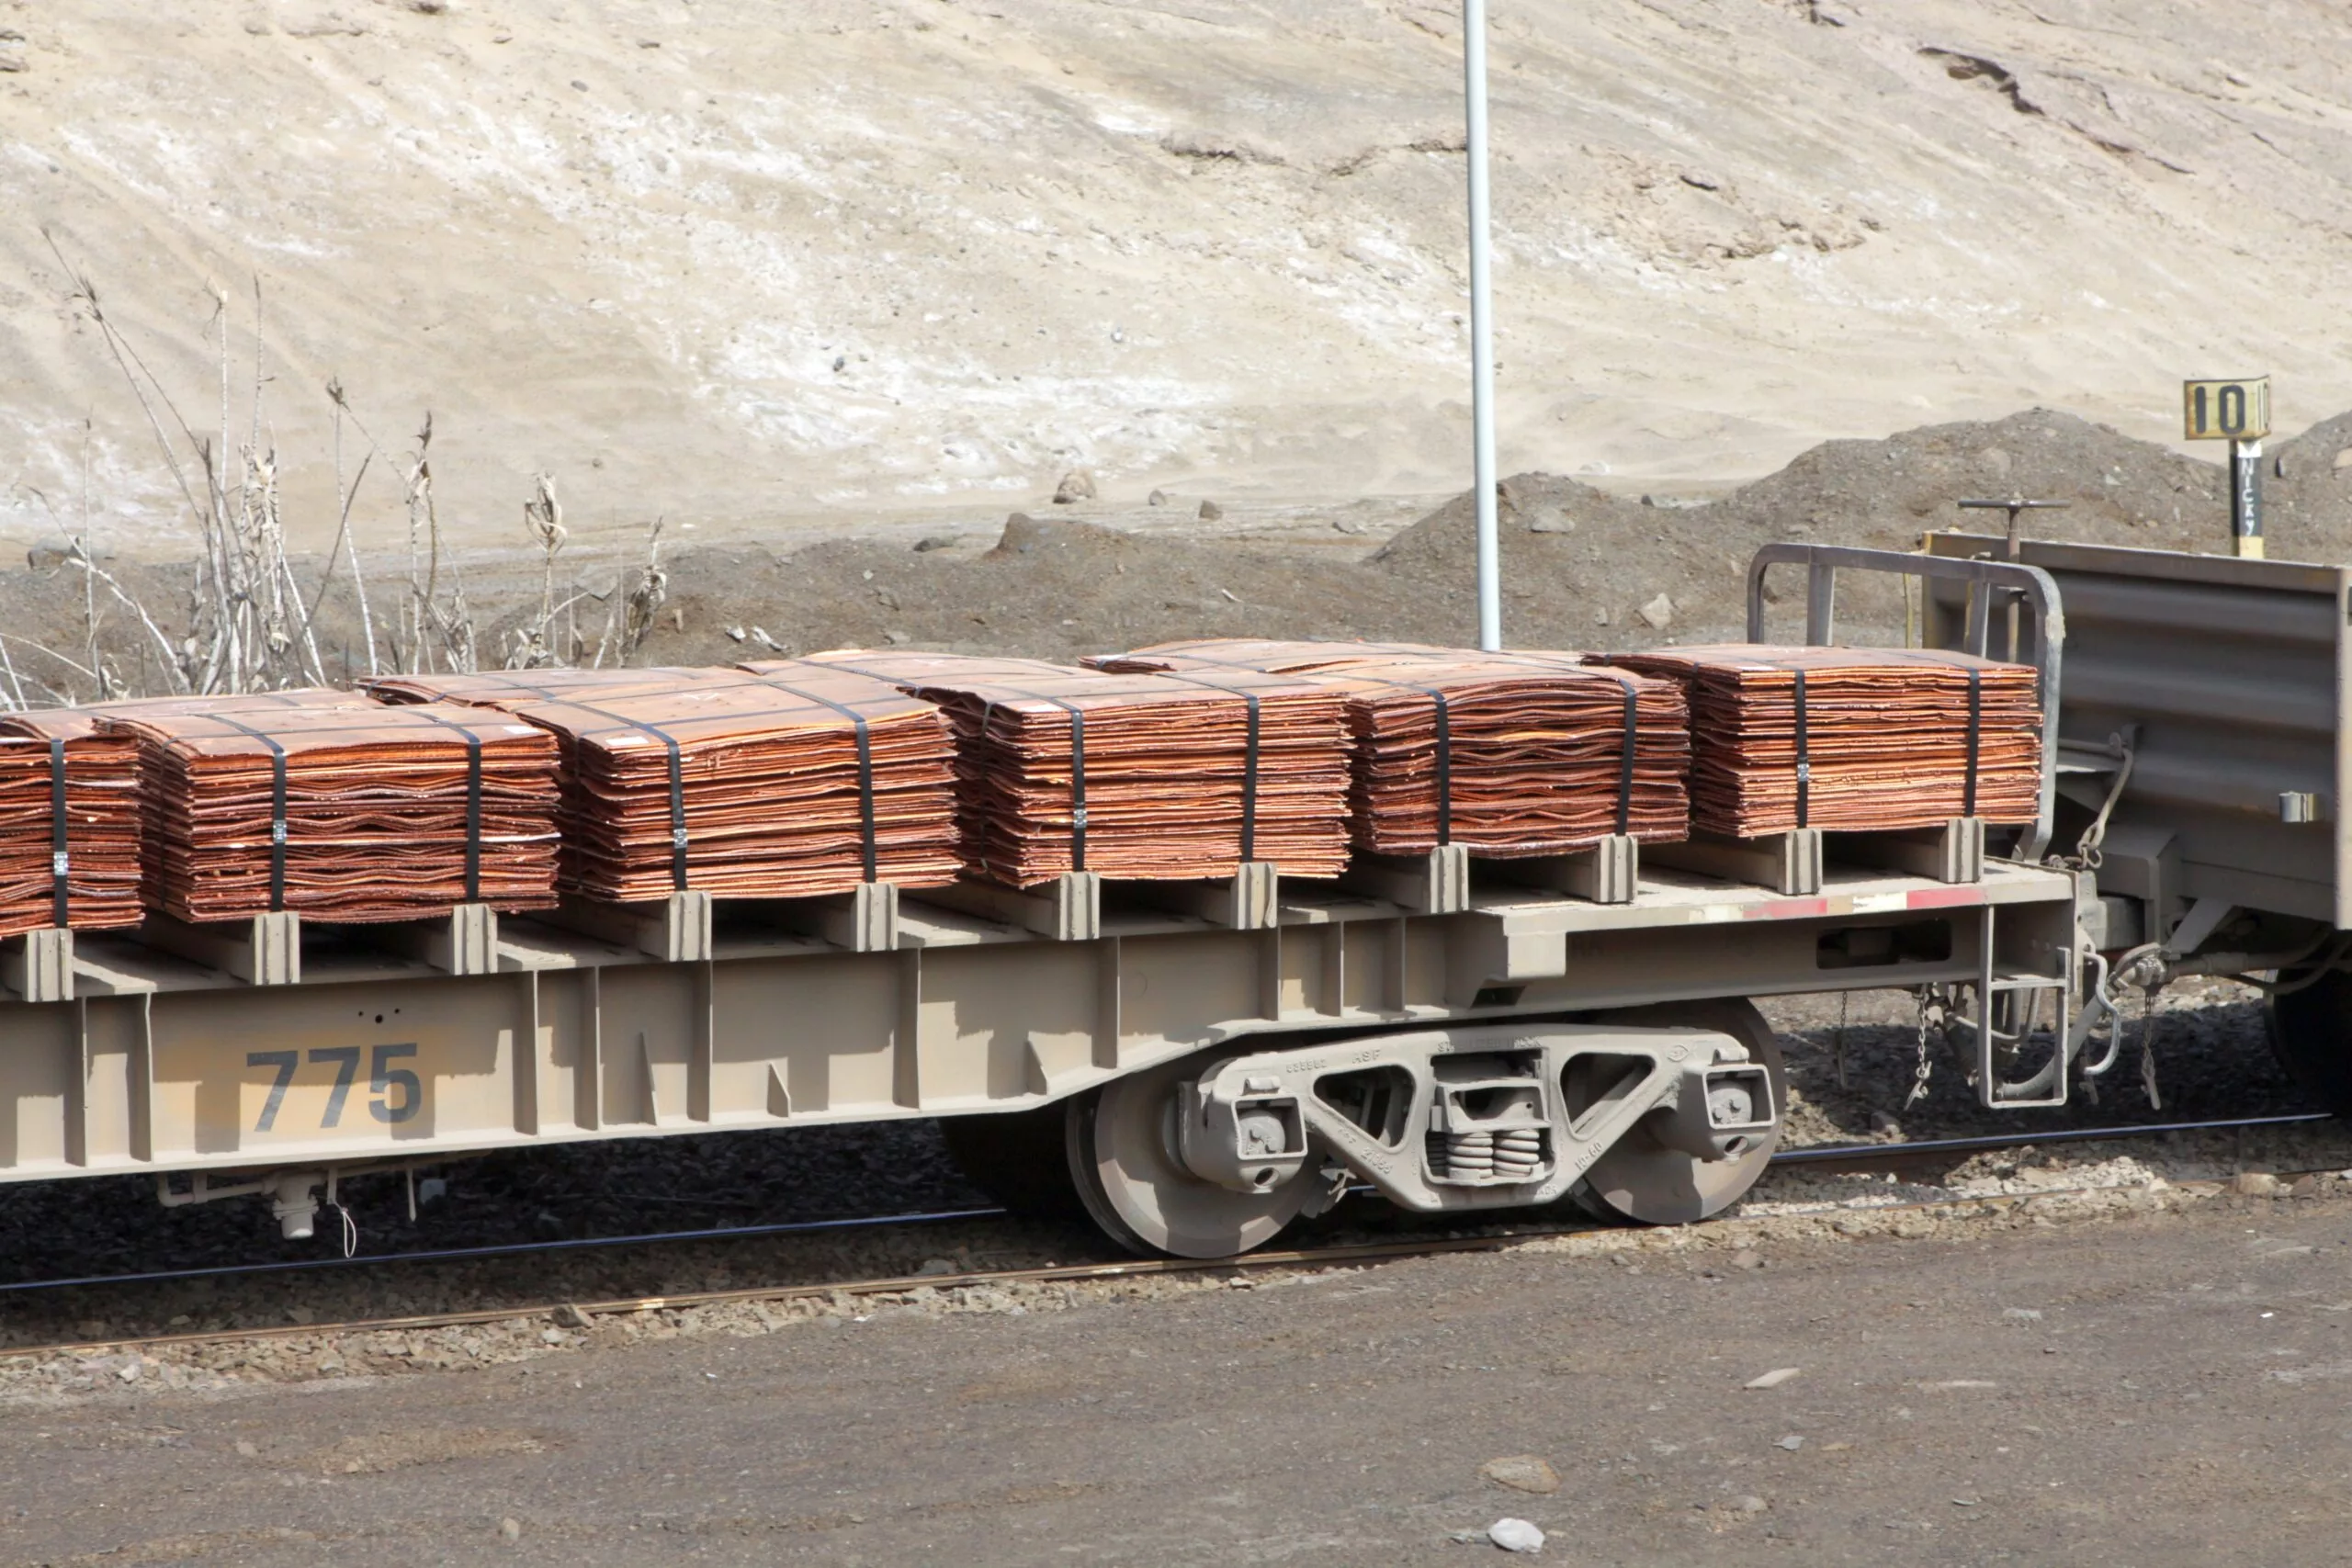
Chile · MINING
Key Facts
- —Output drop Chile copper production fell 9.4% year on year in July 2026, to 403,424 tonnes from 445,322 tonnes.
- —Data source INE, Chile’s national statistics institute, published the figures in its industrial production index on 31 August 2026.
- —Cause INE cited unfavourable weather in the north that hindered normal production, plus scheduled maintenance at major operations.
- —Context Chile is the world’s largest copper producer, with mines mainly in the arid north
- —Impact A fall of about 42,000 tonnes in one month matters because copper is Chile’s largest export by value.
Bad weather and maintenance took nearly a tenth off the July output of the world’s biggest copper producer.
Chile copper production fell 9.4% in July 2026 against the same month a year earlier. The data comes from INE, the national statistics institute.
Severe storms in the northern mining regions disrupted output, which dropped to 403,424 tonnes from 445,322 tonnes in July 2025.
Why Chile Copper Production Slipped
Chile copper production took a sharp hit in July, falling 9.4% year on year. INE, Chile’s national statistics institute, reported output of 403,424 tonnes, down from 445,322 tonnes in July 2025.
INE attributed the fall to unfavourable weather conditions in the north of the country, which hindered the normal production process. It added that maintenance was carried out at important operations in the sector during the period.
Storms between 15 and 20 July put Coquimbo and Atacama under a catastrophe declaration. Lundin Mining’s Caserones lost power when a transmission tower came down, and Antofagasta Minerals cut its production target because of weather interruptions.
Exact Dates and Data Source
The figures come from INE’s industrial production index, published on 31 August 2026, and are provisional.
For context, Chile’s copper production in July 2025 was 445,322 tonnes. Therefore, the drop of about 42,000 tonnes is significant for a single month.
Why the North Matters
Chile is the world’s largest copper producer, and its mines sit mainly in the arid north. Heavy rain is rare there, so when storms arrive, they can be highly disruptive.
In fact, the region is not built for wet weather, which means even moderate rainfall can halt operations. As a result, the July storms had an outsized effect on output.
Who Is Affected
Anyone who relies on copper wiring, motors, or grids could feel the ripple effects. Copper is used in these products, and demand has been supported by electrification and data centre construction.
Moreover, copper is Chile’s largest export by value and a major source of government revenue. Therefore, a production dip like this can affect national finances and global supply chains.
What It Means for Residents
For expats and nomads living in Chile, this news may not change daily life immediately. However, it could influence the economy, since copper revenues help fund public services.
Still, the drop is a reminder of how weather can disrupt key industries. While you might not notice it at the supermarket, it can affect exchange rates and investment sentiment.
How to Get More Data
If you want to track Chile copper production yourself, INE publishes regular industrial and mining reports. You can find them on the INE website, usually around the end of each month.
For July data, the report came out on 31 August 2026. So, for future months, expect similar timing, and you can compare year-on-year figures directly.
Practical Tips for Expats
If you work in mining or related sectors, stay updated on weather forecasts for the north. Because storms are rare, they can cause sudden operational changes.
Additionally, if you’re investing or budgeting, keep an eye on monthly production reports. A 9.4% drop like this can signal broader economic trends, and it is not an isolated month.
Output from January to July 2026 came to about 2.9 million tonnes, down 7.1% on the year and the weakest such period in 23 years.
What to Watch Next
The key question is whether production recovers in August and September. While storms are temporary, recovery can take time, especially if infrastructure was damaged.
In short, watch for INE’s next report to see if Chile copper production bounces back. Meanwhile, global demand for copper remains strong, driven by electrification and data centres.
Final Thoughts
Overall, the July drop highlights the vulnerability of even the world’s largest copper producer. Still, Chile’s mining sector has weathered such events before, and output often rebounds.
For now, the data is clear: Chile copper production fell 9.4% in July. As always, the next few months will tell whether this was a blip or a longer trend.
More: Chile news in English, every day from The Rio Times.
Frequently Asked Questions
When will the next Chile copper production data be released?
INE typically publishes its industrial and mining report around the end of each month. For July data, it came out on 31 August 2026, so expect a similar schedule for August figures.
Why did storms affect copper production so much?
Chile’s copper mines are mostly in the arid north and the semi-arid Norte Chico, where heavy or prolonged rain is rare. When severe storms hit, they can disrupt operations because the infrastructure is not designed for wet conditions.
Is this drop likely to affect copper prices?
Cochilco raised its 2026 average copper price forecast to US$5.95 a pound on 11 August 2026, and expects Chilean output of 5.27 million tonnes this year, down 2.6% on 2025. A fall of 42,000 tonnes in one month could tighten supply, but prices depend on many factors.
How can I track Chile’s copper production as an expat?
You can follow INE’s monthly reports on their website. Look for the industrial and mining section, and compare year-on-year figures to see trends.
Connected Coverage
Sources: INE Chile; Chilean and international mining press.
This article was produced by The Rio Times’ automated newsroom system. How we use AI · Report an error · Editorial responsibility: Matthias Camenzind, Editor-in-Chief
In depth
Copper in Latin America
- Copper in Latin America 2026: Mines, Prices and Politics
- Chile’s State Copper Giant Codelco Explained
- Peru Copper Mining Explained: Output, Big Mines, Exports and Risks in 2026
- Peru Natural Resources Explained 2026