IBOV 174,576.80 ▲ 1.55% IPSA 11,450.75 ▼ 0.76% IPC MEX 65,522.56 ▼ 0.38% MERVAL 3,009,029 ▲ 0.46% COLCAP 2,508.47 ▼ 0.09% BVL PERÚ 60,117.56 ▲ 0.55% USD/BRL5.15▼ 0.02% USD/MXN16.93▼ 0.14% USD/CLP911.95▼ 0.10% USD/COP3,088▲ 0.80% USD/PEN3.35▼ 0.08% USD/ARS1,512▲ 0.13% USD/UYU40.18▲ 1.06% USD/PYG5,968▲ 0.82% USD/BOB11.47▲ 0.68% USD/DOP58.01▲ 0.07% USD/CRC447.25▲ 0.82% USD/GTQ7.62▲ 2.02% USD/HNL26.82▲ 1.52% USD/NIO36.62▲ 0.09% USD/VES785.55▲ 0.19% USD/PAB1.00— 0.00% USD/BZD2.00— 0.00% USD/JMD 157.28 — 0.00% USD/TTD6.73▲ 0.97% EUR/BRL6.01▼ 0.07% BRENT 88.88 ▼ 0.03% WTI 83.11 ▼ 0.11% IRON ORE 161.91 — — COPPER 6.61 ▲ 0.03% GOLD 4,461 ▲ 1.78% SILVER 65.59 ▲ 1.26% SOY 1,184 ▲ 3.20% CORN 480.50 ▲ 10.02% WHEAT 655.00 ▲ 3.93% COFFEE 317.25 ▼ 5.51% SUGAR 16.43 ▼ 1.79% ORANGE JUICE 138.55 ▼ 0.47% COTTON 85.03 ▲ 2.33% COCOA 5,719 ▲ 3.18% BEEF 223.60 ▼ 3.93% CATTLE 339.10 ▼ 3.16% LITHIUM 75.20 ▲ 1.47% PETR4 41.64 ▼ 0.05% VALE3 72.97 ▲ 0.83% ITUB4 38.60 ▼ 1.03% BBDC4 16.85 ▲ 0.36% ABEV3 14.89 ▼ 0.80% BBAS3 19.37 ▲ 0.47% B3SA3 14.26 ▼ 0.21% WEGE3 47.59 ▲ 0.49% PRIO3 59.14 ▼ 0.19% SUZB3 41.33 ▲ 2.35% RENT3 34.68 ▼ 0.09% AZZA3 15.89 ▼ 2.63% CSAN3 3.22 ▼ 1.83% RAIZ4 0.25 — 0.00% PCAR3 2.75 ▼ 0.36% GMAT3 3.65 ▼ 1.08% PSSA3 48.13 ▼ 0.54% CVCB3 1.33 ▼ 2.92% POSI3 3.36 ▲ 2.44% SLCE3 13.34 ▲ 0.30% NATU3 8.14 ▼ 0.73% IBOV 174,576.80 ▲ 1.55% IPSA 11,450.75 ▼ 0.76% IPC MEX 65,522.56 ▼ 0.38% MERVAL 3,009,029 ▲ 0.46% COLCAP 2,508.47 ▼ 0.09% BVL PERÚ 60,117.56 ▲ 0.55% USD/BRL 5.16 ▲ 0.01% USD/MXN 17.06 ▼ 0.24% USD/CLP 913.98 ▲ 0.04% USD/COP 3,140 ▲ 0.03% USD/PEN 3.36 ▼ 0.66% USD/ARS 1,493 ▲ 0.10% USD/UYU 40.27 ▲ 1.24% USD/PYG 5,939 ▲ 1.68% USD/BOB 11.64 ▼ 0.76% USD/DOP 58.34 ▲ 1.25% USD/CRC 445.92 ▲ 0.89% USD/GTQ 7.62 ▲ 2.21% USD/HNL 26.79 ▲ 1.57% USD/NIO 36.62 ▲ 0.69% USD/VES 762.44 ▼ 0.13% USD/PAB 1.00 — 0.00% USD/BZD 2.00 — 0.00% USD/JMD 157.28 — 0.00% USD/TTD 6.70 ▲ 0.61% EUR/BRL 5.95 ▲ 1.01% BRENT 88.88 ▼ 0.03% WTI 83.11 ▼ 0.11% IRON ORE 161.91 — — COPPER 6.61 ▲ 0.03% GOLD 4,461 ▲ 1.78% SILVER 65.59 ▲ 1.26% SOY 1,184 ▲ 3.20% CORN 480.50 ▲ 10.02% WHEAT 655.00 ▲ 3.93% COFFEE 317.25 ▼ 5.51% SUGAR 16.43 ▼ 1.79% ORANGE JUICE 138.55 ▼ 0.47% COTTON 85.03 ▲ 2.33% COCOA 5,719 ▲ 3.18% BEEF 223.60 ▼ 3.93% CATTLE 339.10 ▼ 3.16% LITHIUM 75.20 ▲ 1.47% PETR4 41.64 ▼ 0.05% VALE3 72.97 ▲ 0.83% ITUB4 38.60 ▼ 1.03% BBDC4 16.85 ▲ 0.36% ABEV3 14.89 ▼ 0.80% BBAS3 19.37 ▲ 0.47% B3SA3 14.26 ▼ 0.21% WEGE3 47.59 ▲ 0.49% PRIO3 59.14 ▼ 0.19% SUZB3 41.33 ▲ 2.35% RENT3 34.68 ▼ 0.09% AZZA3 15.89 ▼ 2.63% CSAN3 3.22 ▼ 1.83% RAIZ4 0.25 — 0.00% PCAR3 2.75 ▼ 0.36% GMAT3 3.65 ▼ 1.08% PSSA3 48.13 ▼ 0.54% CVCB3 1.33 ▼ 2.92% POSI3 3.36 ▲ 2.44% SLCE3 13.34 ▲ 0.30% NATU3 8.14 ▼ 0.73%
since 2009
Wednesday, August 26, 2026

Brazil Business - Brazil

Brazilian Industrial Production Dips in Most Regions, IBGE Reports

By · October 8, 2024 · 2 min read

Daily Brief

The morning intel from across Latin America. Free.

By subscribing you agree to our privacy policy. We never share your email.

The Brazilian Institute of Geography and Statistics (IBGE) released its latest Regional Monthly Industrial Survey. The report shows a decline in industrial output across most of Brazil’s regions in August.

This data provides insight into the country’s economic landscape and manufacturing sector performance. Ten out of fifteen surveyed areas experienced a decrease in industrial production from July to August.

The most significant drops occurred in Pará, Paraná, and Rio Grande do Sul. These states saw their industrial output fall by 3.5%, 3.5%, and 3.0%, respectively.

São Paulo, Brazil’s industrial powerhouse, also faced a downturn. The state’s production decreased by 1% during the same period. This decline in São Paulo carries weight due to its crucial role in the national economy.

However, not all regions saw a decrease in industrial activity. Five areas bucked the trend and reported growth. Ceará led the pack with a 2.7% increase in production. Minas Gerais followed with a 1.8% rise.
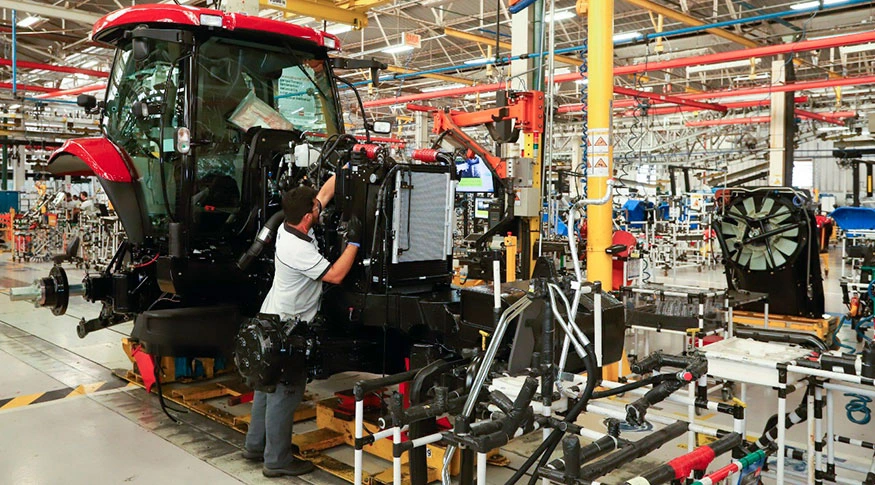
Brazilian Industrial Production Dips in Most Regions, IBGE Reports
Brazilian Industrial Production Dips in Most Regions, IBGE Reports. (Photo Internet reproduction)
One-stop reference
Company Intelligence
Every listed company in Latin America — financials, ownership and structure for 1,450+ companies across 26 exchanges, in one place.
Browse the directory →
RT
Ask Rio Times
Latin American markets, currencies and companies.
Open the full Ask Rio Times →

Bahia and Mato Grosso both saw 0.8% growth, while Rio de Janeiro recorded a modest 0.2% increase. Despite these regional variations, Brazil’s overall industrial production inched up by 0.1% in August compared to July.

Brazil’s Manufacturing Sector

This slight increase suggests a mixed picture for the country’s manufacturing sector. When comparing August 2024 to the same month in 2023, the outlook appears more positive.

Twelve out of eighteen surveyed areas showed growth in industrial production. Ceará stood out with an impressive 17.3% year-on-year increase.

On a national scale, Brazil’s industrial production grew by 2.2% compared to August 2023. This annual growth indicates some resilience in the country’s manufacturing sector despite monthly fluctuations.

The IBGE‘s report highlights the uneven nature of Brazil’s industrial recovery. While some regions struggle, others show signs of growth.

In short, this data helps policymakers and businesses understand the current state of Brazil’s industrial landscape.

This article was produced by The Rio Times’ automated newsroom system. How we use AI · Report an error

LatAm Markets: Live Signals → — real-time movers, turnover leaders and FX across Latin America.

Read More from The Rio Times

The Rio Times · Power Map
See who really holds power in Latin America
Click to open the Power Map

Rotate for Best Experience

This report is optimized for landscape viewing. Rotate your phone for the full experience.