Covid-19 Fatality Rate in Brazil is Higher Among Blacks and Illiterate
RIO DE JANEIRO, BRAZIL – The Covid-19 epidemic has further deepened Brazilian inequalities, as shown in the latest note from the Center for Health Operations and Intelligence (NOIS), a group of academics based at PUC-Rio University. Race is the largest contributing factor.
In any statistical segment of victims, the chance of a black or mixed-race individual dying from Covid-19 is always greater than that of a white person. The peak of this gap occurs in the comparison between illiterate blacks and higher-educated whites – 80 versus 19 percent.

The group used data from the Ministry of Health updated until May 18th and assessed some 30,000 confirmed cases of Covid-19 with an outcome – either medical discharge or death.
Death rates directly reflect socioeconomic inequalities, in addition to the age pyramid and geographical distribution.
“The progression of confirmed Covid-19 cases has been influenced by socioeconomic factors, in addition to the contagion dynamics of an epidemic,” said the scientists in the study. “Brazil’s mortality rate is very high, influenced by inequalities in access to treatment”.
According to the data analyzed, approximately ten thousand patients were identified as white and almost nine thousand as “negro”, the official classification of black and mixed-race individuals, according to the Brazilian Institute of Geography and Statistics’s (IBGE).
Despite the similar number of cases, when only deaths are evaluated, the difference is brutal: 55 percent of black and mixed-race patients died, against 38 percent of whites.
The schooling differences are also reflected in deaths. Those without schooling present three times higher rates (71 percent) than those with a higher level (22.5 percent). Inequalities in income and access to basic health services explain the differences in impact.
When scientists combined race and education, inequalities became even more marked, always showing a higher percentage of deaths for black and mixed-race individuals in all levels of schooling. On average, this difference is 37 percent.
However, the greatest difference between victims’ susceptibility comes when contrasting uneducated negros against highly educated whites: the former are four times more likely (80 percent against 19 percent) to die than the latter .
Among the approximately 30,000 cases assessed, around 55 percent had been discharged from hospital. The majority of the cases were of people between 50 and 70 years of age; for those over 60 the percentage of deaths was over 50 percent, and among those over 90, it was 84 percent. There are more deaths as the age group increases.
The patients’ geographical location also has a direct impact on their chances of surviving the disease. The NOIS study showed that in a city with low or medium Human Development Index (HDI) the chance of death is almost twice that in a city with a very high HDI.
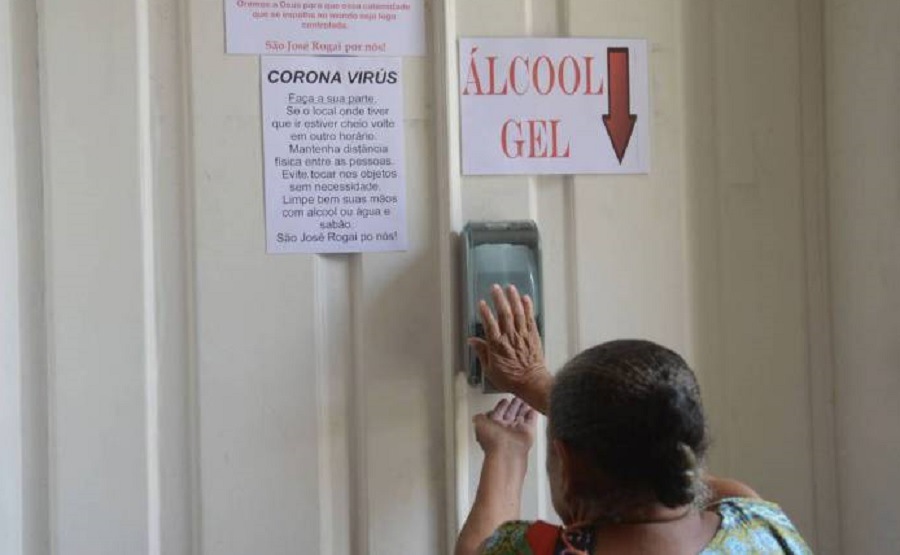
“The analysis shows discrepancies,” concluded the scientists, noting that “the proportion of deaths among negro individuals was higher than that of whites, whether by age, schooling level and in municipalities with high HDI, thereby confirming the vast differences in access and quality of treatment in Brazil.
NOIS is made up of scientists from the Pontifical Catholic University (PUC), Fiocruz, UFRJ (Federal University of Rio de Janeiro) and the Dor Research Institute.
Source: O Estado de S. Paulo.
More: Brazil news in English, every day from The Rio Times.
This article was drafted with automated assistance and reviewed before publication. How we use AI · Report an error · Editorial responsibility: Matthias Camenzind, Editor-in-Chief
Brazil runoff, Sunday, October 25: Brazil runoff start time and results schedule. Latest: Brazil runoff polls, Flávio 51%, Lula 49%.