IBOV 185,229.17 ▼ 0.41% IPSA 11,381.18 ▲ 1.30% IPC MEX 63,375.93 ▼ 0.78% MERVAL 3,021,926 ▼ 1.29% COLCAP 2,548.22 ▲ 1.05% BVL PERÚ 60,023.65 ▼ 1.13% USD/BRL5.14▲ 0.02% USD/MXN17.23▼ 0.02% USD/CLP959.00▼ 0.31% USD/COP3,176▲ 0.05% USD/PEN3.37▼ 0.07% USD/ARS1,514▼ 0.03% USD/UYU40.16▲ 2.99% USD/PYG5,906▲ 3.00% USD/BOB9.95▲ 1.26% USD/DOP58.75▲ 2.26% USD/CRC444.45▲ 2.50% USD/GTQ7.63▲ 3.11% USD/HNL26.85▲ 3.16% USD/NIO36.62— 0.00% USD/VES847.44▼ 0.13% USD/PAB1.00— 0.00% USD/BZD2.00— 0.00% USD/JMD 157.28 — 0.00% USD/TTD6.75▲ 2.45% EUR/BRL5.91▲ 0.60% BRENT 88.88 ▼ 0.03% WTI 83.11 ▼ 0.11% IRON ORE 161.91 — — COPPER 6.61 ▲ 0.03% GOLD 4,461 ▲ 1.78% SILVER 65.59 ▲ 1.26% SOY 1,184 ▲ 3.20% CORN 480.50 ▲ 10.02% WHEAT 655.00 ▲ 3.93% COFFEE 317.25 ▼ 5.51% SUGAR 16.43 ▼ 1.79% ORANGE JUICE 138.55 ▼ 0.47% COTTON 85.03 ▲ 2.33% COCOA 5,719 ▲ 3.18% BEEF 223.60 ▼ 3.93% CATTLE 339.10 ▼ 3.16% LITHIUM 75.20 ▲ 1.47% PETR4 41.64 ▼ 0.05% VALE3 72.97 ▲ 0.83% ITUB4 38.60 ▼ 1.03% BBDC4 16.85 ▲ 0.36% ABEV3 14.89 ▼ 0.80% BBAS3 19.37 ▲ 0.47% B3SA3 14.26 ▼ 0.21% WEGE3 47.59 ▲ 0.49% PRIO3 59.14 ▼ 0.19% SUZB3 41.33 ▲ 2.35% RENT3 34.68 ▼ 0.09% AZZA3 15.89 ▼ 2.63% CSAN3 3.22 ▼ 1.83% RAIZ4 0.25 — 0.00% PCAR3 2.75 ▼ 0.36% GMAT3 3.65 ▼ 1.08% PSSA3 48.13 ▼ 0.54% CVCB3 1.33 ▼ 2.92% POSI3 3.36 ▲ 2.44% SLCE3 13.34 ▲ 0.30% NATU3 8.14 ▼ 0.73% IBOV 185,229.17 ▼ 0.41% IPSA 11,381.18 ▲ 1.30% IPC MEX 63,375.93 ▼ 0.78% MERVAL 3,021,926 ▼ 1.29% COLCAP 2,548.22 ▲ 1.05% BVL PERÚ 60,023.65 ▼ 1.13% USD/BRL 5.16 ▲ 0.01% USD/MXN 17.06 ▼ 0.24% USD/CLP 913.98 ▲ 0.04% USD/COP 3,140 ▲ 0.03% USD/PEN 3.36 ▼ 0.66% USD/ARS 1,493 ▲ 0.10% USD/UYU 40.27 ▲ 1.24% USD/PYG 5,939 ▲ 1.68% USD/BOB 11.64 ▼ 0.76% USD/DOP 58.34 ▲ 1.25% USD/CRC 445.92 ▲ 0.89% USD/GTQ 7.62 ▲ 2.21% USD/HNL 26.79 ▲ 1.57% USD/NIO 36.62 ▲ 0.69% USD/VES 762.44 ▼ 0.13% USD/PAB 1.00 — 0.00% USD/BZD 2.00 — 0.00% USD/JMD 157.28 — 0.00% USD/TTD 6.70 ▲ 0.61% EUR/BRL 5.95 ▲ 1.01% BRENT 88.88 ▼ 0.03% WTI 83.11 ▼ 0.11% IRON ORE 161.91 — — COPPER 6.61 ▲ 0.03% GOLD 4,461 ▲ 1.78% SILVER 65.59 ▲ 1.26% SOY 1,184 ▲ 3.20% CORN 480.50 ▲ 10.02% WHEAT 655.00 ▲ 3.93% COFFEE 317.25 ▼ 5.51% SUGAR 16.43 ▼ 1.79% ORANGE JUICE 138.55 ▼ 0.47% COTTON 85.03 ▲ 2.33% COCOA 5,719 ▲ 3.18% BEEF 223.60 ▼ 3.93% CATTLE 339.10 ▼ 3.16% LITHIUM 75.20 ▲ 1.47% PETR4 41.64 ▼ 0.05% VALE3 72.97 ▲ 0.83% ITUB4 38.60 ▼ 1.03% BBDC4 16.85 ▲ 0.36% ABEV3 14.89 ▼ 0.80% BBAS3 19.37 ▲ 0.47% B3SA3 14.26 ▼ 0.21% WEGE3 47.59 ▲ 0.49% PRIO3 59.14 ▼ 0.19% SUZB3 41.33 ▲ 2.35% RENT3 34.68 ▼ 0.09% AZZA3 15.89 ▼ 2.63% CSAN3 3.22 ▼ 1.83% RAIZ4 0.25 — 0.00% PCAR3 2.75 ▼ 0.36% GMAT3 3.65 ▼ 1.08% PSSA3 48.13 ▼ 0.54% CVCB3 1.33 ▼ 2.92% POSI3 3.36 ▲ 2.44% SLCE3 13.34 ▲ 0.30% NATU3 8.14 ▼ 0.73%
since 2009
Monday, September 21, 2026

Agri Business Brazil

Brazil Grows Its Fruit Exports, Yet Infrastructure Holds Back Gains

By · April 25, 2025 · 2 min read

The LatAm Brief

One email, every weekday morning. What moved in Latin American markets, politics and expat life.

Yesterday’s subject line: “Bolivia's 83% fuel shock, hours after the IMF loan”

Free. We send a confirmation link first — nothing arrives until you click it. Unsubscribe with one click in any edition. If you stop opening us for 30 days we stop sending by ourselves, as we assume the interest is no longer there. See our privacy policy. We never share your email.

Brazil’s fruit export sector, according to official data from the Companhia Nacional de Abastecimento (Conab), posted a 26% increase in shipments in the first quarter of 2025 compared to the same period last year.

Exporters shipped 301,000 tonnes of fruit, generating $311 million in revenue. This growth continues a trend from 2024, when total fruit exports reached $1.3 billion.

However, Brazil remains the third-largest fruit producer globally but only ranks 24th in exports, with just 2–2.5% of its production reaching foreign markets. The surge in exports comes mainly from strong demand in Europe.

The Netherlands, United Kingdom, and Spain remain top buyers. Melons, watermelons, lemons, limes, mangoes, and bananas led the export list. Melon exports alone reached $70.9 million from 93,200 tonnes, up nearly 25% in volume.

Watermelon exports grew 90% in volume and 91% in revenue, while banana exports jumped 131% to 15,700 tonnes. Papaya and apple exports also rose, with apples seeing an 85.6% volume increase.
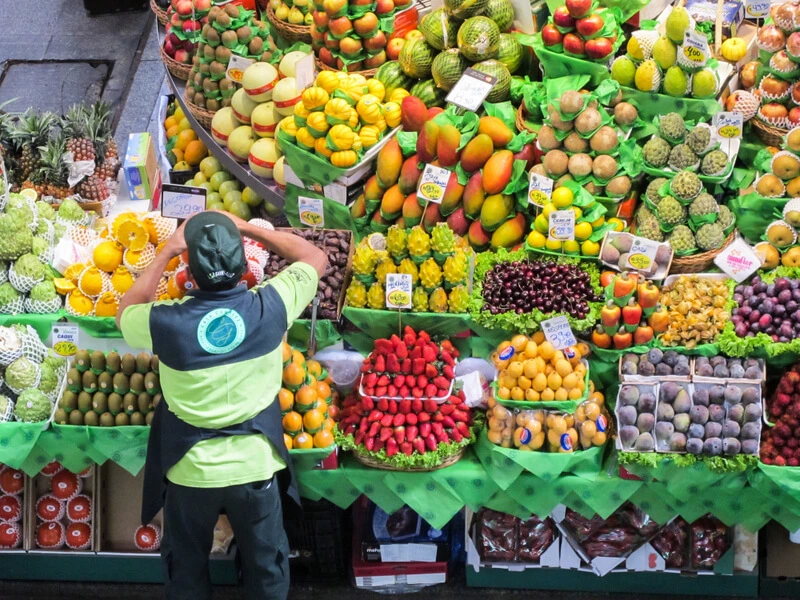
Brazil Grows Its Fruit Exports, Yet Infrastructure Holds Back Gains
Brazil Grows Its Fruit Exports, Yet Infrastructure Holds Back Gains.
One-stop reference
Company Intelligence
Every listed company in Latin America — financials, ownership and structure for 1,450+ companies across 26 exchanges, in one place.
Browse the directory →
RT
Ask Rio Times
Latin American markets, currencies and companies.
Open the full Ask Rio Times →

However, orange and orange juice exports dropped sharply, down 52% and 22.8% respectively, due to lower production and quality issues in the citrus sector. Despite these gains, Brazil’s fruit sector faces major logistical barriers.

Brazil’s Fruit Export Dilemma

The country’s underdeveloped infrastructure, especially in refrigerated transport and storage, limits its ability to expand exports. Most fruit production occurs in the northeast, far from major ports and airports in the southeast.

Road transport to these hubs can take three days, raising costs and risking quality loss. Many airports lack proper cold storage, making it difficult to maintain the cold chain for delicate fruits like papaya and mango.

Exporters and logistics operators report that port congestion, inefficient shipping schedules, and weather-related disruptions further slow shipments. These challenges make Brazilian fruit less competitive in distant markets such as Asia, despite growing demand.

The industry continues to invest in quality and logistics, but experts agree that overcoming these bottlenecks is crucial for Brazil to turn its production strength into export dominance.

Brazil’s fruit export story is one of strong demand and growing international recognition, but real expansion depends on solving persistent logistical problems. The sector’s future hinges on infrastructure improvements and more efficient supply chains.

This article was produced by The Rio Times’ automated newsroom system. How we use AI · Report an error

Read More from The Rio Times

The Rio Times · Power Map
See who really holds power in Latin America
Click to open the Power Map

Rotate for Best Experience

This report is optimized for landscape viewing. Rotate your phone for the full experience.