IBOV 185,500.88 ▼ 0.91% IPSA 11,342.39 ▲ 1.09% IPC MEX 63,845.28 ▼ 0.12% MERVAL 3,084,547 ▼ 0.46% COLCAP 2,588.25 ▼ 0.06% BVL PERÚ 59,184.75 ▼ 0.92% USD/BRL5.14▲ 0.44% USD/MXN17.15▲ 0.07% USD/CLP959.00▲ 1.75% USD/COP3,106▲ 0.87% USD/PEN3.36▼ 0.07% USD/ARS1,508▼ 0.08% USD/UYU40.20▼ 0.15% USD/PYG5,985▲ 1.38% USD/BOB11.45▼ 4.42% USD/DOP58.60▼ 0.42% USD/CRC444.07▼ 0.78% USD/GTQ7.62▼ 0.07% USD/HNL26.85— 0.00% USD/NIO36.62▲ 2.77% USD/VES840.10▼ 0.13% USD/PAB1.00— 0.00% USD/BZD2.00— 0.00% USD/JMD 157.28 — 0.00% USD/TTD6.74▼ 0.08% EUR/BRL5.93▼ 0.28% BRENT 88.88 ▼ 0.03% WTI 83.11 ▼ 0.11% IRON ORE 161.91 — — COPPER 6.61 ▲ 0.03% GOLD 4,461 ▲ 1.78% SILVER 65.59 ▲ 1.26% SOY 1,184 ▲ 3.20% CORN 480.50 ▲ 10.02% WHEAT 655.00 ▲ 3.93% COFFEE 317.25 ▼ 5.51% SUGAR 16.43 ▼ 1.79% ORANGE JUICE 138.55 ▼ 0.47% COTTON 85.03 ▲ 2.33% COCOA 5,719 ▲ 3.18% BEEF 223.60 ▼ 3.93% CATTLE 339.10 ▼ 3.16% LITHIUM 75.20 ▲ 1.47% PETR4 41.64 ▼ 0.05% VALE3 72.97 ▲ 0.83% ITUB4 38.60 ▼ 1.03% BBDC4 16.85 ▲ 0.36% ABEV3 14.89 ▼ 0.80% BBAS3 19.37 ▲ 0.47% B3SA3 14.26 ▼ 0.21% WEGE3 47.59 ▲ 0.49% PRIO3 59.14 ▼ 0.19% SUZB3 41.33 ▲ 2.35% RENT3 34.68 ▼ 0.09% AZZA3 15.89 ▼ 2.63% CSAN3 3.22 ▼ 1.83% RAIZ4 0.25 — 0.00% PCAR3 2.75 ▼ 0.36% GMAT3 3.65 ▼ 1.08% PSSA3 48.13 ▼ 0.54% CVCB3 1.33 ▼ 2.92% POSI3 3.36 ▲ 2.44% SLCE3 13.34 ▲ 0.30% NATU3 8.14 ▼ 0.73% IBOV 185,500.88 ▼ 0.91% IPSA 11,342.39 ▲ 1.09% IPC MEX 63,845.28 ▼ 0.12% MERVAL 3,084,547 ▼ 0.46% COLCAP 2,588.25 ▼ 0.06% BVL PERÚ 59,184.75 ▼ 0.92% USD/BRL 5.16 ▲ 0.01% USD/MXN 17.06 ▼ 0.24% USD/CLP 913.98 ▲ 0.04% USD/COP 3,140 ▲ 0.03% USD/PEN 3.36 ▼ 0.66% USD/ARS 1,493 ▲ 0.10% USD/UYU 40.27 ▲ 1.24% USD/PYG 5,939 ▲ 1.68% USD/BOB 11.64 ▼ 0.76% USD/DOP 58.34 ▲ 1.25% USD/CRC 445.92 ▲ 0.89% USD/GTQ 7.62 ▲ 2.21% USD/HNL 26.79 ▲ 1.57% USD/NIO 36.62 ▲ 0.69% USD/VES 762.44 ▼ 0.13% USD/PAB 1.00 — 0.00% USD/BZD 2.00 — 0.00% USD/JMD 157.28 — 0.00% USD/TTD 6.70 ▲ 0.61% EUR/BRL 5.95 ▲ 1.01% BRENT 88.88 ▼ 0.03% WTI 83.11 ▼ 0.11% IRON ORE 161.91 — — COPPER 6.61 ▲ 0.03% GOLD 4,461 ▲ 1.78% SILVER 65.59 ▲ 1.26% SOY 1,184 ▲ 3.20% CORN 480.50 ▲ 10.02% WHEAT 655.00 ▲ 3.93% COFFEE 317.25 ▼ 5.51% SUGAR 16.43 ▼ 1.79% ORANGE JUICE 138.55 ▼ 0.47% COTTON 85.03 ▲ 2.33% COCOA 5,719 ▲ 3.18% BEEF 223.60 ▼ 3.93% CATTLE 339.10 ▼ 3.16% LITHIUM 75.20 ▲ 1.47% PETR4 41.64 ▼ 0.05% VALE3 72.97 ▲ 0.83% ITUB4 38.60 ▼ 1.03% BBDC4 16.85 ▲ 0.36% ABEV3 14.89 ▼ 0.80% BBAS3 19.37 ▲ 0.47% B3SA3 14.26 ▼ 0.21% WEGE3 47.59 ▲ 0.49% PRIO3 59.14 ▼ 0.19% SUZB3 41.33 ▲ 2.35% RENT3 34.68 ▼ 0.09% AZZA3 15.89 ▼ 2.63% CSAN3 3.22 ▼ 1.83% RAIZ4 0.25 — 0.00% PCAR3 2.75 ▼ 0.36% GMAT3 3.65 ▼ 1.08% PSSA3 48.13 ▼ 0.54% CVCB3 1.33 ▼ 2.92% POSI3 3.36 ▲ 2.44% SLCE3 13.34 ▲ 0.30% NATU3 8.14 ▼ 0.73%
since 2009
Tuesday, September 15, 2026

Agri Business Business - Brazil

Brazil Defies Global Wine Production Decline

By · April 26, 2024 · 2 min read

The LatAm Brief

One email, every weekday morning. What moved in Latin American markets, politics and expat life.

Yesterday’s subject line: “Brazil's Supreme Court judges one of its own”

Free. We send a confirmation link first — nothing arrives until you click it. Unsubscribe with one click in any edition. If you stop opening us for 30 days we stop sending by ourselves, as we assume the interest is no longer there. See our privacy policy. We never share your email.

In 2023, global wine production fell by 10%, reaching its lowest point since 1961 with a harvest of 237 million hectoliters.

This information is sourced from the International Organisation of Vine and Wine (OIV), a leading authority in global wine and vine data.

Consumption fell by 3%, marking a difficult year worldwide. Italy and Spain experienced significant declines of 23% and 21% due to harsh weather.

John Barker, director of the OIV, linked these declines to severe environmental issues such as droughts, floods, and wildfires.

These events significantly lowered yields in both hemispheres. Specifically, Chile, Australia, and South Africa each faced over 10% reductions, while Argentina recorded a 23% drop, the lowest since 1957.
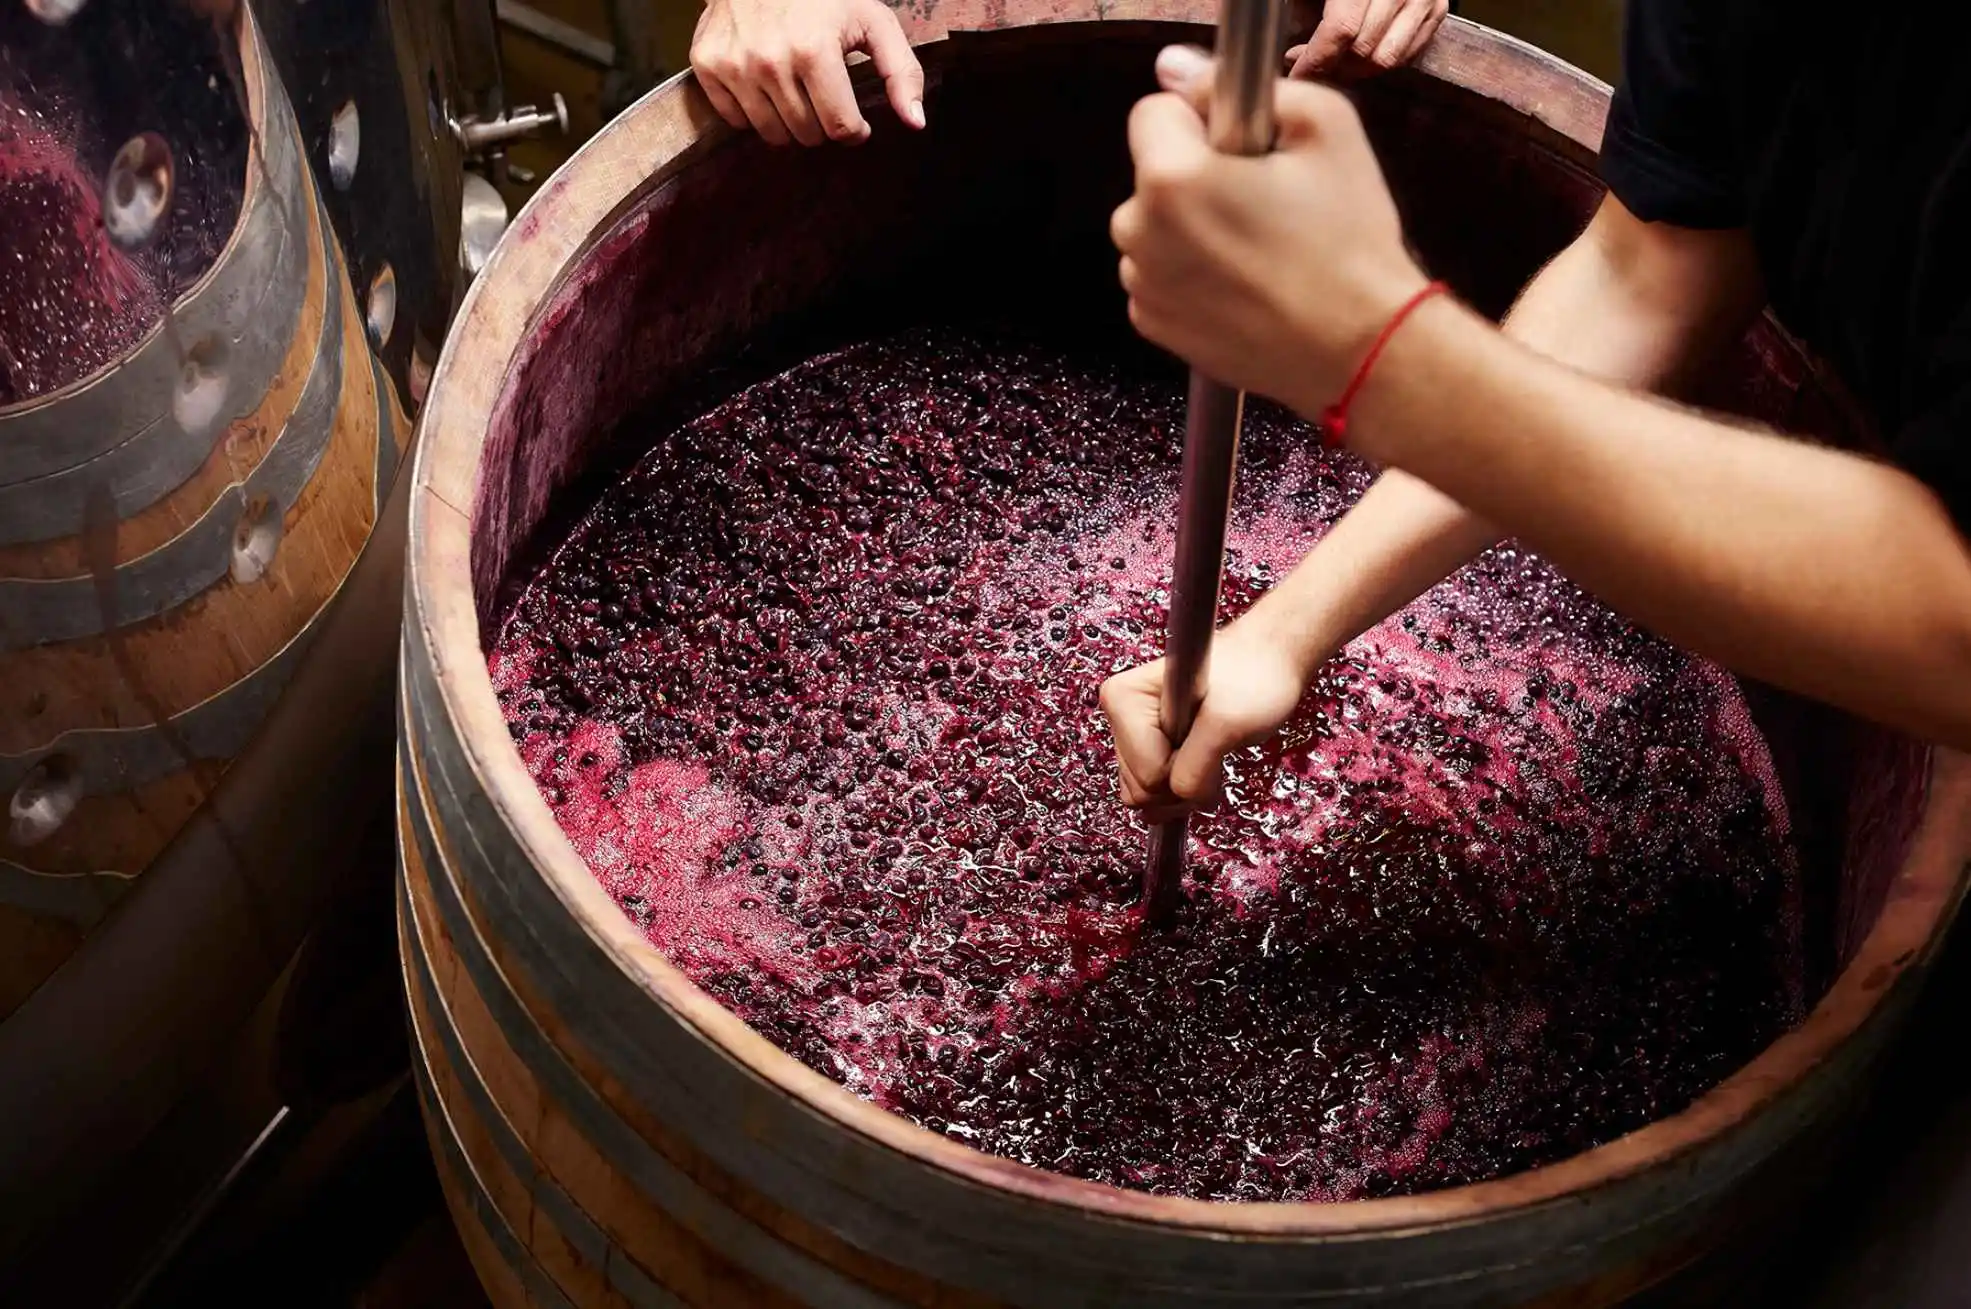
Brazil Defies Global Wine Production Decline.
One-stop reference
Company Intelligence
Every listed company in Latin America — financials, ownership and structure for 1,450+ companies across 26 exchanges, in one place.
Browse the directory →
RT
Ask Rio Times
Latin American markets, currencies and companies.
Open the full Ask Rio Times →

In contrast, Brazil showed remarkable resilience, boosting its wine production by 12.1% from the previous year and exceeding the five-year average by 31.4%.

This surge occurred as Southern Hemisphere nations anticipate a 5% production recovery in 2024.

Meanwhile, France raised its output by 4%, maintaining its lead as the top global producer.

On the consumption front, global figures declined to 221 million hectoliters, the least since 1996. Only a few countries, like Spain, observed growth.

In South America, Brazilian wine consumption rose by 11.6% to pre-pandemic levels, while Argentina’s fell to a record low, dropping by 6.2%.

Brazil Defies Global Wine Production Decline

The trend of falling global wine demand has persisted since 2018 and was briefly interrupted in 2021 when COVID-19 restrictions lifted.

However, inflation aggravated this trend by raising production costs and consumer prices.

Lifestyle and demographic changes also influenced consumption, especially in high per capita consumption countries like Portugal, France, and Italy.

Wine exports decreased by 6% in volume, hitting their lowest mark since 2010. This decline could be attributed to increased export prices.

Meanwhile, the global vineyard space continued to contract, decreasing by 0.5% to 7.2 million hectares.

Conversely, Brazil expanded its vineyard area by 1.5% to 83,000 hectares, defying global trends.

Despite climate challenges impacting grapevines, Brazil’s wine industry shows significant adaptability and growth potential amid global shifts.

This article was drafted with automated assistance and reviewed before publication. How we use AI · Report an error

Read More from The Rio Times

The Rio Times · Power Map
See who really holds power in Latin America
Click to open the Power Map

Rotate for Best Experience

This report is optimized for landscape viewing. Rotate your phone for the full experience.