IBOV 186,595.60 ▲ 0.74% IPSA 11,357.82 ▼ 0.21% IPC MEX 63,375.93 ▼ 0.78% MERVAL 2,998,956 ▼ 0.76% COLCAP 2,565.55 ▲ 0.68% BVL PERÚ 59,344.04 ▲ 0.31% USD/BRL5.10▼ 0.74% USD/MXN17.20▼ 0.16% USD/CLP946.95▼ 1.30% USD/COP3,193▲ 0.57% USD/PEN3.37▼ 0.09% USD/ARS1,514▼ 0.03% USD/UYU40.14▼ 0.05% USD/PYG5,926▲ 0.34% USD/BOB10.95▲ 10.05% USD/DOP59.26▲ 0.87% USD/CRC443.27▼ 0.27% USD/GTQ7.63▼ 0.05% USD/HNL26.86▲ 0.03% USD/NIO36.62— 0.00% USD/VES847.44▼ 0.13% USD/PAB1.00— 0.00% USD/BZD2.00— 0.00% USD/JMD 157.28 — 0.00% USD/TTD6.76▲ 0.17% EUR/BRL5.86▼ 0.83% BRENT 88.88 ▼ 0.03% WTI 83.11 ▼ 0.11% IRON ORE 161.91 — — COPPER 6.61 ▲ 0.03% GOLD 4,461 ▲ 1.78% SILVER 65.59 ▲ 1.26% SOY 1,184 ▲ 3.20% CORN 480.50 ▲ 10.02% WHEAT 655.00 ▲ 3.93% COFFEE 317.25 ▼ 5.51% SUGAR 16.43 ▼ 1.79% ORANGE JUICE 138.55 ▼ 0.47% COTTON 85.03 ▲ 2.33% COCOA 5,719 ▲ 3.18% BEEF 223.60 ▼ 3.93% CATTLE 339.10 ▼ 3.16% LITHIUM 75.20 ▲ 1.47% PETR4 41.64 ▼ 0.05% VALE3 72.97 ▲ 0.83% ITUB4 38.60 ▼ 1.03% BBDC4 16.85 ▲ 0.36% ABEV3 14.89 ▼ 0.80% BBAS3 19.37 ▲ 0.47% B3SA3 14.26 ▼ 0.21% WEGE3 47.59 ▲ 0.49% PRIO3 59.14 ▼ 0.19% SUZB3 41.33 ▲ 2.35% RENT3 34.68 ▼ 0.09% AZZA3 15.89 ▼ 2.63% CSAN3 3.22 ▼ 1.83% RAIZ4 0.25 — 0.00% PCAR3 2.75 ▼ 0.36% GMAT3 3.65 ▼ 1.08% PSSA3 48.13 ▼ 0.54% CVCB3 1.33 ▼ 2.92% POSI3 3.36 ▲ 2.44% SLCE3 13.34 ▲ 0.30% NATU3 8.14 ▼ 0.73% IBOV 186,595.60 ▲ 0.74% IPSA 11,357.82 ▼ 0.21% IPC MEX 63,375.93 ▼ 0.78% MERVAL 2,998,956 ▼ 0.76% COLCAP 2,565.55 ▲ 0.68% BVL PERÚ 59,344.04 ▲ 0.31% USD/BRL 5.16 ▲ 0.01% USD/MXN 17.06 ▼ 0.24% USD/CLP 913.98 ▲ 0.04% USD/COP 3,140 ▲ 0.03% USD/PEN 3.36 ▼ 0.66% USD/ARS 1,493 ▲ 0.10% USD/UYU 40.27 ▲ 1.24% USD/PYG 5,939 ▲ 1.68% USD/BOB 11.64 ▼ 0.76% USD/DOP 58.34 ▲ 1.25% USD/CRC 445.92 ▲ 0.89% USD/GTQ 7.62 ▲ 2.21% USD/HNL 26.79 ▲ 1.57% USD/NIO 36.62 ▲ 0.69% USD/VES 762.44 ▼ 0.13% USD/PAB 1.00 — 0.00% USD/BZD 2.00 — 0.00% USD/JMD 157.28 — 0.00% USD/TTD 6.70 ▲ 0.61% EUR/BRL 5.95 ▲ 1.01% BRENT 88.88 ▼ 0.03% WTI 83.11 ▼ 0.11% IRON ORE 161.91 — — COPPER 6.61 ▲ 0.03% GOLD 4,461 ▲ 1.78% SILVER 65.59 ▲ 1.26% SOY 1,184 ▲ 3.20% CORN 480.50 ▲ 10.02% WHEAT 655.00 ▲ 3.93% COFFEE 317.25 ▼ 5.51% SUGAR 16.43 ▼ 1.79% ORANGE JUICE 138.55 ▼ 0.47% COTTON 85.03 ▲ 2.33% COCOA 5,719 ▲ 3.18% BEEF 223.60 ▼ 3.93% CATTLE 339.10 ▼ 3.16% LITHIUM 75.20 ▲ 1.47% PETR4 41.64 ▼ 0.05% VALE3 72.97 ▲ 0.83% ITUB4 38.60 ▼ 1.03% BBDC4 16.85 ▲ 0.36% ABEV3 14.89 ▼ 0.80% BBAS3 19.37 ▲ 0.47% B3SA3 14.26 ▼ 0.21% WEGE3 47.59 ▲ 0.49% PRIO3 59.14 ▼ 0.19% SUZB3 41.33 ▲ 2.35% RENT3 34.68 ▼ 0.09% AZZA3 15.89 ▼ 2.63% CSAN3 3.22 ▼ 1.83% RAIZ4 0.25 — 0.00% PCAR3 2.75 ▼ 0.36% GMAT3 3.65 ▼ 1.08% PSSA3 48.13 ▼ 0.54% CVCB3 1.33 ▼ 2.92% POSI3 3.36 ▲ 2.44% SLCE3 13.34 ▲ 0.30% NATU3 8.14 ▼ 0.73%
since 2009
Monday, September 21, 2026

Latin America Mexico

Behind the Export Gains: Mexico’s Battle to Hold Its Place in U.S. Trade

By · August 5, 2025 · 2 min read

The LatAm Brief

One email, every weekday morning. What moved in Latin American markets, politics and expat life.

Yesterday’s subject line: “Venezuela's New York week: oil signed, the bounty stays”

Free. We send a confirmation link first — nothing arrives until you click it. Unsubscribe with one click in any edition. If you stop opening us for 30 days we stop sending by ourselves, as we assume the interest is no longer there. See our privacy policy. We never share your email.

Official trade reports show that Mexico exported $264.4 billion in goods to the United States in the first half of 2025. This marks a 6.3% increase over the previous year.

Most exports are cars, electronics, and machinery, produced mainly in northern industrial states. More than 80% of Mexico’s total exports go straight to the U.S., making this partnership crucial to Mexico’s economy.

Yet, the surface numbers tell only part of the story. Even as exports hit new highs, Mexico’s share of the U.S. import market slipped to about 15%. Bigger rivals like Canada and China narrowed the gap.

The auto industry, usually strong for Mexico, saw a 6.3% drop in exports due to new U.S. tariffs and slower car sales. These official figures signal that simply exporting more does not guarantee security.

The U.S. and Mexico rely on each other’s factories, so changes in trade rules or demand quickly affect jobs and investments. Nearshoring—the move by U.S. companies to build or expand plants in Mexico—has boosted trade.
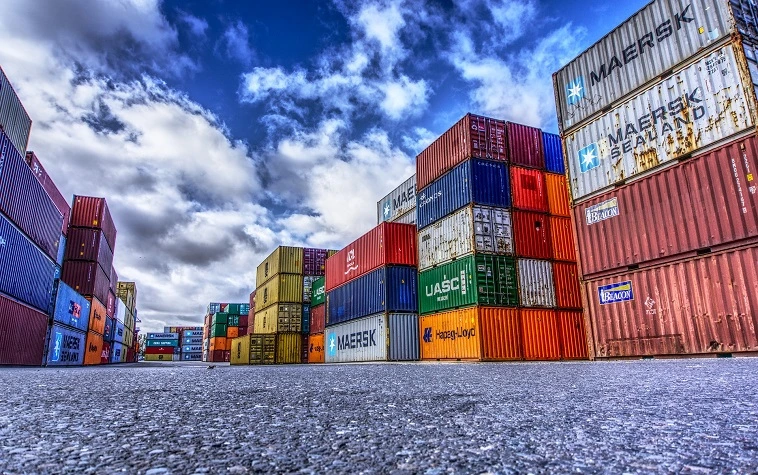
Behind the Export Gains: Mexico’s Battle to Hold Its Place in U.S. Trade
Behind the Export Gains: Mexico’s Battle to Hold Its Place in U.S. Trade.
One-stop reference
Company Intelligence
Every listed company in Latin America — financials, ownership and structure for 1,450+ companies across 26 exchanges, in one place.
Browse the directory →
RT
Ask Rio Times
17 years of Latin America reporting, on demand.
Open the full Ask Rio Times →

Yet, it also makes both economies vulnerable to policy shifts, tariffs, and economic slowdowns.

For people and businesses worldwide, Mexico’s story is a reminder that economic wins can mask deeper risks.

Growth often hides rising competition, volatile sectors, and dependencies that can shift with one bill or policy. Reliable trade data backs these insights and shows just how quickly fortunes can turn.

Mexico’s increased exports look like a clear win. In reality, it is a good headline masking tight race conditions and challenges beneath the surface.

These numbers matter beyond Mexico or the U.S.; they reflect how global trade now depends on smart, fast moves and constant adaptation—realities faced by countries everywhere.

Key Facts

Deep Dive

For the complete picture, read our in-depth guide: Mexico Economy 2026: GDP, Peso, Nearshoring, Banxico and Trade

This article was produced by The Rio Times’ automated newsroom system. How we use AI · Report an error

Read More from The Rio Times

The Rio Times · Power Map
See who really holds power in Latin America
Click to open the Power Map

Rotate for Best Experience

This report is optimized for landscape viewing. Rotate your phone for the full experience.