IBOV 185,899.93 ▼ 0.37% IPSA 11,410.19 ▲ 0.46% IPC MEX 63,536.96 ▲ 0.25% MERVAL 2,990,605 ▼ 0.28% COLCAP 2,570.03 ▲ 0.17% BVL PERÚ 59,529.36 ▲ 0.20% USD/BRL5.11▲ 0.09% USD/MXN17.30▲ 0.45% USD/CLP947.66▼ 0.16% USD/COP3,209▲ 1.04% USD/PEN3.36▼ 0.48% USD/ARS1,513▼ 0.08% USD/UYU40.06▲ 2.88% USD/PYG5,918▲ 3.14% USD/BOB11.85▲ 25.24% USD/DOP58.80▲ 2.88% USD/CRC445.27▲ 2.84% USD/GTQ7.63▲ 3.24% USD/HNL26.86▲ 3.32% USD/NIO36.62▲ 2.80% USD/VES850.29▼ 0.13% USD/PAB1.00— 0.00% USD/BZD2.00— 0.00% USD/JMD 157.28 — 0.00% USD/TTD6.74▲ 2.48% EUR/BRL5.85▼ 0.82% BRENT 88.88 ▼ 0.03% WTI 83.11 ▼ 0.11% IRON ORE 161.91 — — COPPER 6.61 ▲ 0.03% GOLD 4,461 ▲ 1.78% SILVER 65.59 ▲ 1.26% SOY 1,184 ▲ 3.20% CORN 480.50 ▲ 10.02% WHEAT 655.00 ▲ 3.93% COFFEE 317.25 ▼ 5.51% SUGAR 16.43 ▼ 1.79% ORANGE JUICE 138.55 ▼ 0.47% COTTON 85.03 ▲ 2.33% COCOA 5,719 ▲ 3.18% BEEF 223.60 ▼ 3.93% CATTLE 339.10 ▼ 3.16% LITHIUM 75.20 ▲ 1.47% PETR4 41.64 ▼ 0.05% VALE3 72.97 ▲ 0.83% ITUB4 38.60 ▼ 1.03% BBDC4 16.85 ▲ 0.36% ABEV3 14.89 ▼ 0.80% BBAS3 19.37 ▲ 0.47% B3SA3 14.26 ▼ 0.21% WEGE3 47.59 ▲ 0.49% PRIO3 59.14 ▼ 0.19% SUZB3 41.33 ▲ 2.35% RENT3 34.68 ▼ 0.09% AZZA3 15.89 ▼ 2.63% CSAN3 3.22 ▼ 1.83% RAIZ4 0.25 — 0.00% PCAR3 2.75 ▼ 0.36% GMAT3 3.65 ▼ 1.08% PSSA3 48.13 ▼ 0.54% CVCB3 1.33 ▼ 2.92% POSI3 3.36 ▲ 2.44% SLCE3 13.34 ▲ 0.30% NATU3 8.14 ▼ 0.73% IBOV 185,899.93 ▼ 0.37% IPSA 11,410.19 ▲ 0.46% IPC MEX 63,536.96 ▲ 0.25% MERVAL 2,990,605 ▼ 0.28% COLCAP 2,570.03 ▲ 0.17% BVL PERÚ 59,529.36 ▲ 0.20% USD/BRL 5.16 ▲ 0.01% USD/MXN 17.06 ▼ 0.24% USD/CLP 913.98 ▲ 0.04% USD/COP 3,140 ▲ 0.03% USD/PEN 3.36 ▼ 0.66% USD/ARS 1,493 ▲ 0.10% USD/UYU 40.27 ▲ 1.24% USD/PYG 5,939 ▲ 1.68% USD/BOB 11.64 ▼ 0.76% USD/DOP 58.34 ▲ 1.25% USD/CRC 445.92 ▲ 0.89% USD/GTQ 7.62 ▲ 2.21% USD/HNL 26.79 ▲ 1.57% USD/NIO 36.62 ▲ 0.69% USD/VES 762.44 ▼ 0.13% USD/PAB 1.00 — 0.00% USD/BZD 2.00 — 0.00% USD/JMD 157.28 — 0.00% USD/TTD 6.70 ▲ 0.61% EUR/BRL 5.95 ▲ 1.01% BRENT 88.88 ▼ 0.03% WTI 83.11 ▼ 0.11% IRON ORE 161.91 — — COPPER 6.61 ▲ 0.03% GOLD 4,461 ▲ 1.78% SILVER 65.59 ▲ 1.26% SOY 1,184 ▲ 3.20% CORN 480.50 ▲ 10.02% WHEAT 655.00 ▲ 3.93% COFFEE 317.25 ▼ 5.51% SUGAR 16.43 ▼ 1.79% ORANGE JUICE 138.55 ▼ 0.47% COTTON 85.03 ▲ 2.33% COCOA 5,719 ▲ 3.18% BEEF 223.60 ▼ 3.93% CATTLE 339.10 ▼ 3.16% LITHIUM 75.20 ▲ 1.47% PETR4 41.64 ▼ 0.05% VALE3 72.97 ▲ 0.83% ITUB4 38.60 ▼ 1.03% BBDC4 16.85 ▲ 0.36% ABEV3 14.89 ▼ 0.80% BBAS3 19.37 ▲ 0.47% B3SA3 14.26 ▼ 0.21% WEGE3 47.59 ▲ 0.49% PRIO3 59.14 ▼ 0.19% SUZB3 41.33 ▲ 2.35% RENT3 34.68 ▼ 0.09% AZZA3 15.89 ▼ 2.63% CSAN3 3.22 ▼ 1.83% RAIZ4 0.25 — 0.00% PCAR3 2.75 ▼ 0.36% GMAT3 3.65 ▼ 1.08% PSSA3 48.13 ▼ 0.54% CVCB3 1.33 ▼ 2.92% POSI3 3.36 ▲ 2.44% SLCE3 13.34 ▲ 0.30% NATU3 8.14 ▼ 0.73%
since 2009
Tuesday, September 22, 2026

Surging Demand for Industrial Space in Chile’s Urban Areas

By · September 9, 2024 · 1 min read

The LatAm Brief

One email, every weekday morning. What moved in Latin American markets, politics and expat life.

Yesterday’s subject line: “68 strikes, 223 people. A UN expert says murder.”

Free. We send a confirmation link first — nothing arrives until you click it. Unsubscribe with one click in any edition. If you stop opening us for 30 days we stop sending by ourselves, as we assume the interest is no longer there. See our privacy policy. We never share your email.

In the last six years, industrial land in Chile has expanded by 83%. What started as 10,838 ha in 2017 has now nearly doubled, reaching close to 20,000 ha.

This growth primarily stems from the rise of industrial parks and warehouse districts, spurred by e-commerce’s peak in 2021.

In addition, Javiera Basso, head of advisory and valuation at JLL, attributes this surge to the sector’s robust development.

As e-commerce flourished, areas like Colina and Lampa evolved from peripheral sites into industrial hubs. Originally agricultural, these regions have now been woven into Santiago’s urban fabric.

By the end of 2023, Colina led with 41 million square meters of industrial land. Lampa followed with 36 million square meters, and Pudahuel recorded 24 million square meters.
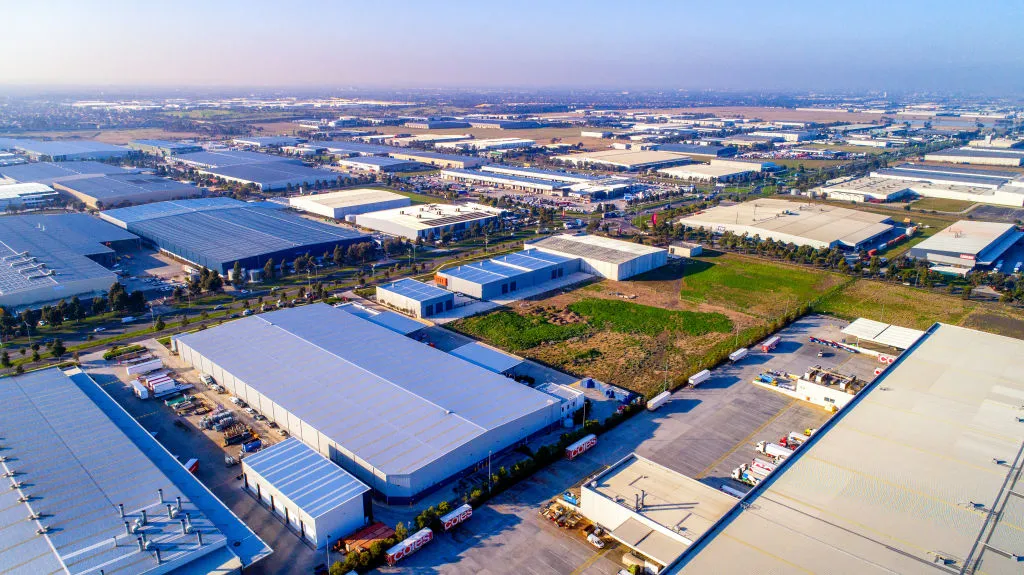
Surging Demand for Industrial Space in Chile's Urban Areas
Surging Demand for Industrial Space in Chile’s Urban Areas.
One-stop reference
Company Intelligence
Every listed company in Latin America — financials, ownership and structure for 1,450+ companies across 26 exchanges, in one place.
Browse the directory →
RT
Ask Rio Times
17 years of Latin America reporting, on demand.
Open the full Ask Rio Times →

These areas represent the core of Santiago‘s industrial expansion. However, the industry faces challenges, as vacancy rates in metropolitan industrial parks have risen.

The first half of 2024 saw these rates increase from 3.2% to 4.7%. This rise signals a shift in the market, despite the sector’s overall growth.

This transformation in land use reflects the profound influence of digital commerce on urban development. As Chile adapts, this trend offers insights into broader economic shifts and planning strategies.

This article was produced by The Rio Times’ automated newsroom system. How we use AI · Report an error

Read More from The Rio Times

The Rio Times · Power Map
See who really holds power in Latin America
Click to open the Power Map

Rotate for Best Experience

This report is optimized for landscape viewing. Rotate your phone for the full experience.