IBOV 185,500.88 ▼ 0.91% IPSA 11,342.39 ▲ 1.09% IPC MEX 63,845.28 ▼ 0.12% MERVAL 3,084,547 ▼ 0.46% COLCAP 2,588.25 ▼ 0.06% BVL PERÚ 59,184.75 ▼ 0.92% USD/BRL5.14▲ 0.44% USD/MXN17.16▲ 0.11% USD/CLP959.00▲ 1.75% USD/COP3,106▲ 0.87% USD/PEN3.36▼ 0.07% USD/ARS1,508▼ 0.08% USD/UYU40.20▼ 0.15% USD/PYG5,985▲ 1.38% USD/BOB11.45▼ 4.42% USD/DOP58.60▼ 0.42% USD/CRC444.07▼ 0.78% USD/GTQ7.62▼ 0.07% USD/HNL26.85— 0.00% USD/NIO36.62▲ 2.77% USD/VES840.10▼ 0.13% USD/PAB1.00— 0.00% USD/BZD2.00— 0.00% USD/JMD 157.28 — 0.00% USD/TTD6.74▼ 0.08% EUR/BRL5.93▼ 0.28% BRENT 88.88 ▼ 0.03% WTI 83.11 ▼ 0.11% IRON ORE 161.91 — — COPPER 6.61 ▲ 0.03% GOLD 4,461 ▲ 1.78% SILVER 65.59 ▲ 1.26% SOY 1,184 ▲ 3.20% CORN 480.50 ▲ 10.02% WHEAT 655.00 ▲ 3.93% COFFEE 317.25 ▼ 5.51% SUGAR 16.43 ▼ 1.79% ORANGE JUICE 138.55 ▼ 0.47% COTTON 85.03 ▲ 2.33% COCOA 5,719 ▲ 3.18% BEEF 223.60 ▼ 3.93% CATTLE 339.10 ▼ 3.16% LITHIUM 75.20 ▲ 1.47% PETR4 41.64 ▼ 0.05% VALE3 72.97 ▲ 0.83% ITUB4 38.60 ▼ 1.03% BBDC4 16.85 ▲ 0.36% ABEV3 14.89 ▼ 0.80% BBAS3 19.37 ▲ 0.47% B3SA3 14.26 ▼ 0.21% WEGE3 47.59 ▲ 0.49% PRIO3 59.14 ▼ 0.19% SUZB3 41.33 ▲ 2.35% RENT3 34.68 ▼ 0.09% AZZA3 15.89 ▼ 2.63% CSAN3 3.22 ▼ 1.83% RAIZ4 0.25 — 0.00% PCAR3 2.75 ▼ 0.36% GMAT3 3.65 ▼ 1.08% PSSA3 48.13 ▼ 0.54% CVCB3 1.33 ▼ 2.92% POSI3 3.36 ▲ 2.44% SLCE3 13.34 ▲ 0.30% NATU3 8.14 ▼ 0.73% IBOV 185,500.88 ▼ 0.91% IPSA 11,342.39 ▲ 1.09% IPC MEX 63,845.28 ▼ 0.12% MERVAL 3,084,547 ▼ 0.46% COLCAP 2,588.25 ▼ 0.06% BVL PERÚ 59,184.75 ▼ 0.92% USD/BRL 5.16 ▲ 0.01% USD/MXN 17.06 ▼ 0.24% USD/CLP 913.98 ▲ 0.04% USD/COP 3,140 ▲ 0.03% USD/PEN 3.36 ▼ 0.66% USD/ARS 1,493 ▲ 0.10% USD/UYU 40.27 ▲ 1.24% USD/PYG 5,939 ▲ 1.68% USD/BOB 11.64 ▼ 0.76% USD/DOP 58.34 ▲ 1.25% USD/CRC 445.92 ▲ 0.89% USD/GTQ 7.62 ▲ 2.21% USD/HNL 26.79 ▲ 1.57% USD/NIO 36.62 ▲ 0.69% USD/VES 762.44 ▼ 0.13% USD/PAB 1.00 — 0.00% USD/BZD 2.00 — 0.00% USD/JMD 157.28 — 0.00% USD/TTD 6.70 ▲ 0.61% EUR/BRL 5.95 ▲ 1.01% BRENT 88.88 ▼ 0.03% WTI 83.11 ▼ 0.11% IRON ORE 161.91 — — COPPER 6.61 ▲ 0.03% GOLD 4,461 ▲ 1.78% SILVER 65.59 ▲ 1.26% SOY 1,184 ▲ 3.20% CORN 480.50 ▲ 10.02% WHEAT 655.00 ▲ 3.93% COFFEE 317.25 ▼ 5.51% SUGAR 16.43 ▼ 1.79% ORANGE JUICE 138.55 ▼ 0.47% COTTON 85.03 ▲ 2.33% COCOA 5,719 ▲ 3.18% BEEF 223.60 ▼ 3.93% CATTLE 339.10 ▼ 3.16% LITHIUM 75.20 ▲ 1.47% PETR4 41.64 ▼ 0.05% VALE3 72.97 ▲ 0.83% ITUB4 38.60 ▼ 1.03% BBDC4 16.85 ▲ 0.36% ABEV3 14.89 ▼ 0.80% BBAS3 19.37 ▲ 0.47% B3SA3 14.26 ▼ 0.21% WEGE3 47.59 ▲ 0.49% PRIO3 59.14 ▼ 0.19% SUZB3 41.33 ▲ 2.35% RENT3 34.68 ▼ 0.09% AZZA3 15.89 ▼ 2.63% CSAN3 3.22 ▼ 1.83% RAIZ4 0.25 — 0.00% PCAR3 2.75 ▼ 0.36% GMAT3 3.65 ▼ 1.08% PSSA3 48.13 ▼ 0.54% CVCB3 1.33 ▼ 2.92% POSI3 3.36 ▲ 2.44% SLCE3 13.34 ▲ 0.30% NATU3 8.14 ▼ 0.73%
since 2009
Tuesday, September 15, 2026

Manufacturing and Mining Drive Chile’s Remarkable Industrial Revival

By · March 28, 2024 · 2 min read

The LatAm Brief

One email, every weekday morning. What moved in Latin American markets, politics and expat life.

Yesterday’s subject line: “Brazil's Supreme Court judges one of its own”

Free. We send a confirmation link first — nothing arrives until you click it. Unsubscribe with one click in any edition. If you stop opening us for 30 days we stop sending by ourselves, as we assume the interest is no longer there. See our privacy policy. We never share your email.

Chile celebrated a landmark achievement in its industrial sector in February, showcasing a substantial annual growth of 7.9%—the highest since March 2018.

As reported by the National Institute of Statistics (INE), this surge signifies a broad-based recovery across multiple sectors, with manufacturing leading the charge.

Notably, the production of paper and related products jumped by 8.8%, highlighting the sector’s strong performance.

The mining sector wasn’t far behind, posting a 7.7% increase due to enhanced extraction of metallic and non-metallic minerals, as well as energy resources.

The sectors producing electricity, gas, and water also saw a notable rise of 5.9%, primarily driven by electricity generation.
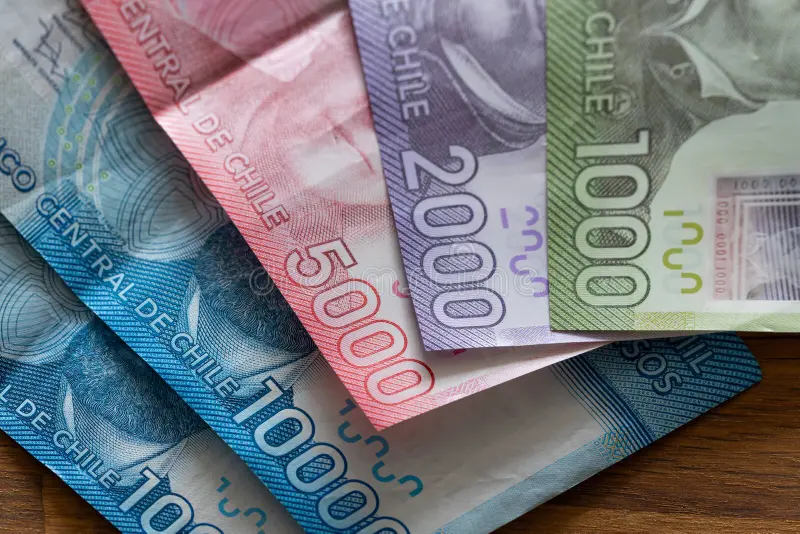
Manufacturing and Mining Drive Chile's Remarkable Industrial Revival.
Manufacturing and Mining Drive Chile’s Remarkable Industrial Revival.
One-stop reference
Company Intelligence
Every listed company in Latin America — financials, ownership and structure for 1,450+ companies across 26 exchanges, in one place.
Browse the directory →
RT
Ask Rio Times
17 years of Latin America reporting, on demand.
Open the full Ask Rio Times →

President Gabriel Boric lauded these developments, signaling optimism for further progress.

As the year unfolded, the upward trend persisted. Industrial output rose by 1.5% in September, mainly due to mining and utilities.

This marked the second consecutive increase, becoming the most significant since December 2021 and highlighting a positive post-pandemic recovery trend.

November’s data further reinforced this trend, with the industrial production index (IPI) climbing 2.7% year over year, thanks to significant contributions from manufacturing and mining.

The manufacturing sector, in particular, benefited from a 19.2% boost in paper production.

Manufacturing and Mining Drive Chile’s Remarkable Industrial Revival

In October, the manufacturing sector’s index rose by 9.5%, driven by a 26.2% increase in chemical production.

Despite a dip in mining, the overall IPI grew by 1.1%, marking the third consecutive monthly increase.

The utilities sector experienced a modest 0.4% growth, supported by renewable energy sources.

These positive trends underscore Chile’s resilience and the industrial sector’s ability to adapt and grow, especially after the global pandemic.

The government’s strategic measures have played a crucial role in this success, particularly in vital areas like mining and manufacturing.

This series of developments not only marks Chile’s return to pre-pandemic industrial activity levels but also sets the stage for further economic stability and growth.

This article was produced by The Rio Times’ automated newsroom system. How we use AI · Report an error

Read More from The Rio Times

The Rio Times · Power Map
See who really holds power in Latin America
Click to open the Power Map

Rotate for Best Experience

This report is optimized for landscape viewing. Rotate your phone for the full experience.