IBOV 183,476.86 ▼ 0.27% IPSA 11,255.90 ▼ 0.39% IPC MEX 64,651.92 ▲ 0.60% MERVAL 2,893,751 ▼ 1.57% COLCAP 2,584.72 ▼ 0.95% BVL PERÚ 59,934.37 ▲ 1.27% USD/BRL5.19▼ 0.12% USD/MXN17.68▼ 0.27% USD/CLP960.63▼ 0.27% USD/COP3,293▲ 0.20% USD/PEN3.39▼ 0.67% USD/ARS1,525▲ 0.30% USD/UYU40.21▲ 3.50% USD/PYG5,870▲ 2.23% USD/BOB12.17▲ 2.05% USD/DOP59.35▲ 0.25% USD/CRC450.87▲ 2.53% USD/GTQ7.64▲ 3.22% USD/HNL26.85▲ 0.31% USD/NIO36.62▲ 2.66% USD/VES853.52▼ 0.13% USD/PAB1.00— 0.00% USD/BZD2.00— 0.00% USD/JMD 157.28 — 0.00% USD/TTD6.77▲ 2.72% EUR/BRL5.91▲ 0.63% BRENT 88.88 ▼ 0.03% WTI 83.11 ▼ 0.11% IRON ORE 161.91 — — COPPER 6.61 ▲ 0.03% GOLD 4,461 ▲ 1.78% SILVER 65.59 ▲ 1.26% SOY 1,184 ▲ 3.20% CORN 480.50 ▲ 10.02% WHEAT 655.00 ▲ 3.93% COFFEE 317.25 ▼ 5.51% SUGAR 16.43 ▼ 1.79% ORANGE JUICE 138.55 ▼ 0.47% COTTON 85.03 ▲ 2.33% COCOA 5,719 ▲ 3.18% BEEF 223.60 ▼ 3.93% CATTLE 339.10 ▼ 3.16% LITHIUM 75.20 ▲ 1.47% PETR4 41.64 ▼ 0.05% VALE3 72.97 ▲ 0.83% ITUB4 38.60 ▼ 1.03% BBDC4 16.85 ▲ 0.36% ABEV3 14.89 ▼ 0.80% BBAS3 19.37 ▲ 0.47% B3SA3 14.26 ▼ 0.21% WEGE3 47.59 ▲ 0.49% PRIO3 59.14 ▼ 0.19% SUZB3 41.33 ▲ 2.35% RENT3 34.68 ▼ 0.09% AZZA3 15.89 ▼ 2.63% CSAN3 3.22 ▼ 1.83% RAIZ4 0.25 — 0.00% PCAR3 2.75 ▼ 0.36% GMAT3 3.65 ▼ 1.08% PSSA3 48.13 ▼ 0.54% CVCB3 1.33 ▼ 2.92% POSI3 3.36 ▲ 2.44% SLCE3 13.34 ▲ 0.30% NATU3 8.14 ▼ 0.73% IBOV 183,476.86 ▼ 0.27% IPSA 11,255.90 ▼ 0.39% IPC MEX 64,651.92 ▲ 0.60% MERVAL 2,893,751 ▼ 1.57% COLCAP 2,584.72 ▼ 0.95% BVL PERÚ 59,934.37 ▲ 1.27% USD/BRL 5.16 ▲ 0.01% USD/MXN 17.06 ▼ 0.24% USD/CLP 913.98 ▲ 0.04% USD/COP 3,140 ▲ 0.03% USD/PEN 3.36 ▼ 0.66% USD/ARS 1,493 ▲ 0.10% USD/UYU 40.27 ▲ 1.24% USD/PYG 5,939 ▲ 1.68% USD/BOB 11.64 ▼ 0.76% USD/DOP 58.34 ▲ 1.25% USD/CRC 445.92 ▲ 0.89% USD/GTQ 7.62 ▲ 2.21% USD/HNL 26.79 ▲ 1.57% USD/NIO 36.62 ▲ 0.69% USD/VES 762.44 ▼ 0.13% USD/PAB 1.00 — 0.00% USD/BZD 2.00 — 0.00% USD/JMD 157.28 — 0.00% USD/TTD 6.70 ▲ 0.61% EUR/BRL 5.95 ▲ 1.01% BRENT 88.88 ▼ 0.03% WTI 83.11 ▼ 0.11% IRON ORE 161.91 — — COPPER 6.61 ▲ 0.03% GOLD 4,461 ▲ 1.78% SILVER 65.59 ▲ 1.26% SOY 1,184 ▲ 3.20% CORN 480.50 ▲ 10.02% WHEAT 655.00 ▲ 3.93% COFFEE 317.25 ▼ 5.51% SUGAR 16.43 ▼ 1.79% ORANGE JUICE 138.55 ▼ 0.47% COTTON 85.03 ▲ 2.33% COCOA 5,719 ▲ 3.18% BEEF 223.60 ▼ 3.93% CATTLE 339.10 ▼ 3.16% LITHIUM 75.20 ▲ 1.47% PETR4 41.64 ▼ 0.05% VALE3 72.97 ▲ 0.83% ITUB4 38.60 ▼ 1.03% BBDC4 16.85 ▲ 0.36% ABEV3 14.89 ▼ 0.80% BBAS3 19.37 ▲ 0.47% B3SA3 14.26 ▼ 0.21% WEGE3 47.59 ▲ 0.49% PRIO3 59.14 ▼ 0.19% SUZB3 41.33 ▲ 2.35% RENT3 34.68 ▼ 0.09% AZZA3 15.89 ▼ 2.63% CSAN3 3.22 ▼ 1.83% RAIZ4 0.25 — 0.00% PCAR3 2.75 ▼ 0.36% GMAT3 3.65 ▼ 1.08% PSSA3 48.13 ▼ 0.54% CVCB3 1.33 ▼ 2.92% POSI3 3.36 ▲ 2.44% SLCE3 13.34 ▲ 0.30% NATU3 8.14 ▼ 0.73%
since 2009
Saturday, September 26, 2026

Petrobras Government Payments Rise, but Fiscal Dependence Deepens

By · September 17, 2025 · 2 min read

The LatAm Brief

One email, every weekday morning. What moved in Latin American markets, politics and expat life.

Yesterday’s subject line: “Colombia broke with Iran — and the peso paid”

Free. We send a confirmation link first — nothing arrives until you click it. Unsubscribe with one click in any edition. If you stop opening us for 30 days we stop sending by ourselves, as we assume the interest is no longer there. See our privacy policy. We never share your email.

Petrobras transferred R$270.3 billion (about $54 billion) to federal, state, and municipal governments in 2024 through taxes, royalties, and special participation fees.

That marked an increase from R$240.2 billion ($46 billion) in 2023 but below the record R$279 billion ($54 billion) in 2022. In 2021, the figure was close to R$203 billion, or about R$230 billion ($44 billion) if dividends to the Union are included.

These totals reflect how government income from oil rose alongside the pre-salt boom and high crude prices, then moderated as markets cooled and fields matured.

Of the 2024 amount, R$62.0 billion (≈$12.4 billion) came specifically from oil and gas exploration and production. Royalties accounted for R$38.1 billion (≈$9.96 billion), while “participação especial” fees on highly productive fields added R$23.6 billion (≈$2.33 billion).

The remainder of Petrobras’s transfers covered corporate income tax, bonuses, and other levies. Brazil’s concession contracts generally require royalties around 10 percent of output value, while large, high-profit fields also face special participation.
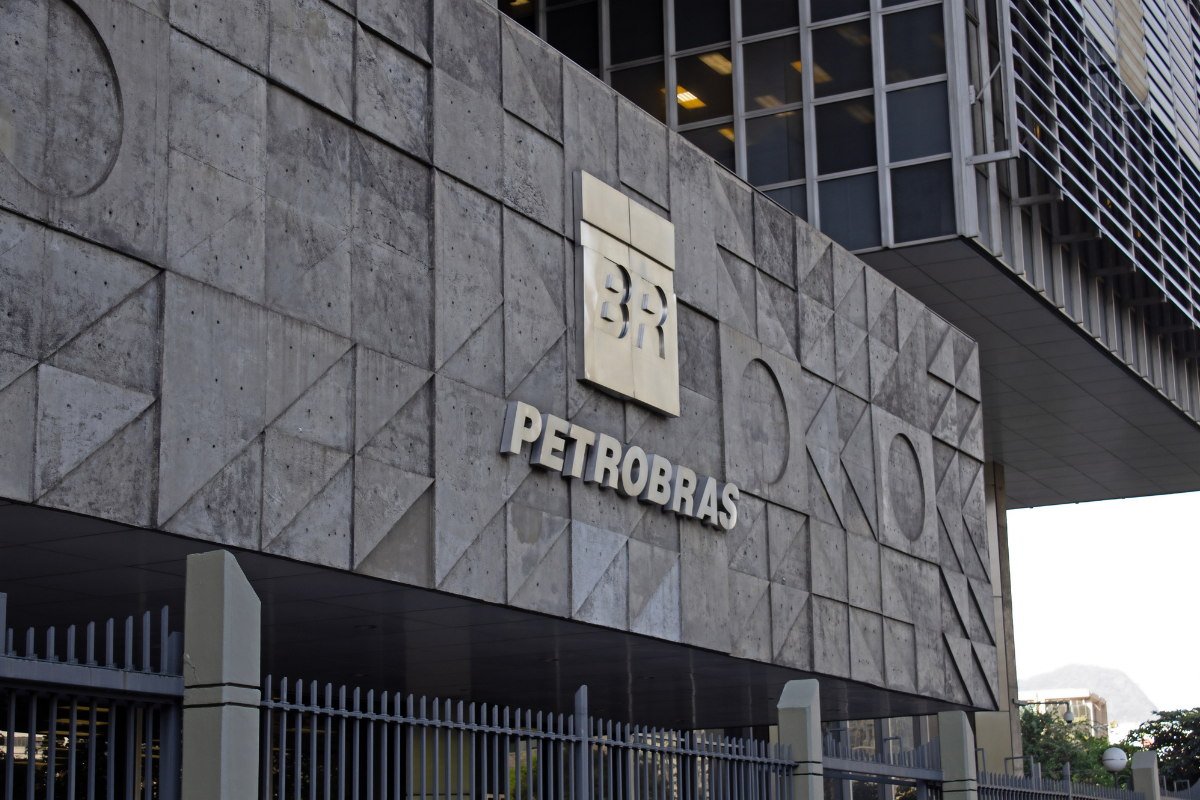
Petrobras Government Payments Rise, but Fiscal Dependence Deepens
Petrobras Government Payments Rise, but Fiscal Dependence Deepens.
RT
Ask Rio Times
Latin American markets, currencies and companies.
Open the full Ask Rio Times →

In production-sharing contracts, Pré-Sal Petróleo S.A. manages the state’s profit-oil share, which in 2024 generated R$10.32 billion for the Treasury. Pre-salt output continues to dominate Brazil’s oil landscape, accounting for more than 70 percent of total production.

It also underpinned record crude exports of $44.8 billion in 2024, overtaking soybeans as the country’s top export. This dominance boosts government coffers but also deepens fiscal dependence on petroleum income.

The Brazilian Institute of Petroleum estimates the oil and gas sector generated over R$325 billion for governments in 2023, enough to cover the entire Education Ministry budget and most of Health.

Yet the future is less predictable. Petrobras faces heavier investment needs in offshore projects and gas infrastructure, while the government has adjusted royalty rules that will shape collections after 2025.

Long-term plans foresee oil production climbing to 4.4 million barrels per day by 2034, though pre-salt peaks may come sooner.

Additional auctions are scheduled to sustain flows. Still, reliance on volatile oil revenues leaves federal and state budgets exposed to commodity swings and eventual resource decline.

Brazil’s experience illustrates a key lesson: natural-resource wealth can transform public finances, but stability requires diversification to protect essential services from market cycles.

Live Company IntelligencePetroleo Brasileiro Petrobras SA ADR — the full investor dossierInside: live share price, market cap, three-year financials, valuation, ESG and peer benchmarks — plus the latest Rio Times coverage.
P
◆ Live Company Intelligence
Petroleo Brasileiro Petrobras
NYSE: PBRPETR4EnergyOil & Gas Integrated43,199 employees
$134.30B
Market cap
Analyst target $22.44

Wall Street view

4.4Buy/ 5
11 Buy3 Hold0 Sell
Avg. price target $22.44  ·  +28% vs 200-day

Valuation & profitability

Market cap$134.30B
Revenue (TTM)$548.49B
P / E ratio5.3
Profit margin24.3%
Return on equity30.3%

Price & risk

52-wk low
$10.65
52-wk high
$21.99
Beta (volatility)-0.21
200-day average$17.57

Revenue trend · 6y

20202025
Latest $88.10B

Ownership

Institutions22.3%
Shares outstanding3.72B
Top holderGQG Partners LLC
Institutional holders5+ funds

Dividend

Yield17.4%
Payout ratio28.3%
Fwd. annual$1.68
What Petroleo Brasileiro Petrobras does. Petróleo Brasileiro S.A. – Petrobras explores, produces, and sells oil and gas in Brazil, China, the United States, the Americas, Asia, Europe, Singapore, and internationally. It operates through three segments: Exploration and Production; Refining, Transportation & Marketing; and Gas & Low Carbon Energies. The Exploration and Production segment explores, develops, and produces…
Data: RT fundamentals (PBR.US) · figures in USD · as of 26 Sep 2026More company intelligence →

This article was produced by The Rio Times’ automated newsroom system. How we use AI · Report an error

LatAm Markets: Live Signals → — real-time movers, turnover leaders and FX across Latin America.

Read More from The Rio Times

The Rio Times · Power Map
See who really holds power in Latin America
Click to open the Power Map →

Rotate for Best Experience

This report is optimized for landscape viewing. Rotate your phone for the full experience.