IBOV 185,992.03 ▲ 0.24% IPSA 11,381.18 ▲ 1.30% IPC MEX 63,684.18 ▲ 0.28% MERVAL 3,061,512 ▲ 1.08% COLCAP 2,521.85 ▲ 0.40% BVL PERÚ 58,965.05 ▲ 1.80% USD/BRL5.12▼ 0.57% USD/MXN17.16▼ 0.51% USD/CLP960.65▲ 0.54% USD/COP3,154▲ 1.02% USD/PEN3.37▲ 0.46% USD/ARS1,510▼ 0.21% USD/UYU40.20▲ 3.11% USD/PYG5,888▲ 2.09% USD/BOB9.75▼ 12.91% USD/DOP58.97▲ 0.20% USD/CRC444.45▲ 2.53% USD/GTQ7.63▲ 3.11% USD/HNL26.85▲ 3.22% USD/NIO36.62▲ 2.69% USD/VES845.33▼ 0.13% USD/PAB1.00— 0.00% USD/BZD2.00— 0.00% USD/JMD 157.28 — 0.00% USD/TTD6.74▲ 2.56% EUR/BRL5.88▼ 0.79% BRENT 88.88 ▼ 0.03% WTI 83.11 ▼ 0.11% IRON ORE 161.91 — — COPPER 6.61 ▲ 0.03% GOLD 4,461 ▲ 1.78% SILVER 65.59 ▲ 1.26% SOY 1,184 ▲ 3.20% CORN 480.50 ▲ 10.02% WHEAT 655.00 ▲ 3.93% COFFEE 317.25 ▼ 5.51% SUGAR 16.43 ▼ 1.79% ORANGE JUICE 138.55 ▼ 0.47% COTTON 85.03 ▲ 2.33% COCOA 5,719 ▲ 3.18% BEEF 223.60 ▼ 3.93% CATTLE 339.10 ▼ 3.16% LITHIUM 75.20 ▲ 1.47% PETR4 41.64 ▼ 0.05% VALE3 72.97 ▲ 0.83% ITUB4 38.60 ▼ 1.03% BBDC4 16.85 ▲ 0.36% ABEV3 14.89 ▼ 0.80% BBAS3 19.37 ▲ 0.47% B3SA3 14.26 ▼ 0.21% WEGE3 47.59 ▲ 0.49% PRIO3 59.14 ▼ 0.19% SUZB3 41.33 ▲ 2.35% RENT3 34.68 ▼ 0.09% AZZA3 15.89 ▼ 2.63% CSAN3 3.22 ▼ 1.83% RAIZ4 0.25 — 0.00% PCAR3 2.75 ▼ 0.36% GMAT3 3.65 ▼ 1.08% PSSA3 48.13 ▼ 0.54% CVCB3 1.33 ▼ 2.92% POSI3 3.36 ▲ 2.44% SLCE3 13.34 ▲ 0.30% NATU3 8.14 ▼ 0.73% IBOV 185,992.03 ▲ 0.24% IPSA 11,381.18 ▲ 1.30% IPC MEX 63,684.18 ▲ 0.28% MERVAL 3,061,512 ▲ 1.08% COLCAP 2,521.85 ▲ 0.40% BVL PERÚ 58,965.05 ▲ 1.80% USD/BRL 5.16 ▲ 0.01% USD/MXN 17.06 ▼ 0.24% USD/CLP 913.98 ▲ 0.04% USD/COP 3,140 ▲ 0.03% USD/PEN 3.36 ▼ 0.66% USD/ARS 1,493 ▲ 0.10% USD/UYU 40.27 ▲ 1.24% USD/PYG 5,939 ▲ 1.68% USD/BOB 11.64 ▼ 0.76% USD/DOP 58.34 ▲ 1.25% USD/CRC 445.92 ▲ 0.89% USD/GTQ 7.62 ▲ 2.21% USD/HNL 26.79 ▲ 1.57% USD/NIO 36.62 ▲ 0.69% USD/VES 762.44 ▼ 0.13% USD/PAB 1.00 — 0.00% USD/BZD 2.00 — 0.00% USD/JMD 157.28 — 0.00% USD/TTD 6.70 ▲ 0.61% EUR/BRL 5.95 ▲ 1.01% BRENT 88.88 ▼ 0.03% WTI 83.11 ▼ 0.11% IRON ORE 161.91 — — COPPER 6.61 ▲ 0.03% GOLD 4,461 ▲ 1.78% SILVER 65.59 ▲ 1.26% SOY 1,184 ▲ 3.20% CORN 480.50 ▲ 10.02% WHEAT 655.00 ▲ 3.93% COFFEE 317.25 ▼ 5.51% SUGAR 16.43 ▼ 1.79% ORANGE JUICE 138.55 ▼ 0.47% COTTON 85.03 ▲ 2.33% COCOA 5,719 ▲ 3.18% BEEF 223.60 ▼ 3.93% CATTLE 339.10 ▼ 3.16% LITHIUM 75.20 ▲ 1.47% PETR4 41.64 ▼ 0.05% VALE3 72.97 ▲ 0.83% ITUB4 38.60 ▼ 1.03% BBDC4 16.85 ▲ 0.36% ABEV3 14.89 ▼ 0.80% BBAS3 19.37 ▲ 0.47% B3SA3 14.26 ▼ 0.21% WEGE3 47.59 ▲ 0.49% PRIO3 59.14 ▼ 0.19% SUZB3 41.33 ▲ 2.35% RENT3 34.68 ▼ 0.09% AZZA3 15.89 ▼ 2.63% CSAN3 3.22 ▼ 1.83% RAIZ4 0.25 — 0.00% PCAR3 2.75 ▼ 0.36% GMAT3 3.65 ▼ 1.08% PSSA3 48.13 ▼ 0.54% CVCB3 1.33 ▼ 2.92% POSI3 3.36 ▲ 2.44% SLCE3 13.34 ▲ 0.30% NATU3 8.14 ▼ 0.73%
since 2009
Friday, September 18, 2026

Petrobras and JBS Lead Revenue Charts in Brazil’s Second Quarter

By · August 26, 2024 · 1 min read

The LatAm Brief

One email, every weekday morning. What moved in Latin American markets, politics and expat life.

Yesterday’s subject line: “The Fed raised. Brazil cut, four hours later.”

Free. We send a confirmation link first — nothing arrives until you click it. Unsubscribe with one click in any edition. If you stop opening us for 30 days we stop sending by ourselves, as we assume the interest is no longer there. See our privacy policy. We never share your email.

Petrobras and JBS led Elos Ayta’s analysis of 26 top-revenue firms on Brazil’s stock exchange, each posting over R$10 billion ($1.8 billion) in Q2 2024.

These two giants topped the revenue charts, with Petrobras earning R$ 122.2 billion ($22 billion) and JBS close behind at R$ 100.6 billion ($18.11 billion).

Petrobras, despite a 28.5% drop from 2023, has surpassed R$ 100 billion for 13 straight quarters since mid-202, according to the study.

Meanwhile, JBS exceeded R$ 100 billion for the first time, a 9.1% year-over-year increase.

The total revenue for the top 26 firms hit R$ 938 billion ($169 billion), up 2.3% from last year. However, this growth lags behind the national inflation rate of 4.23%.
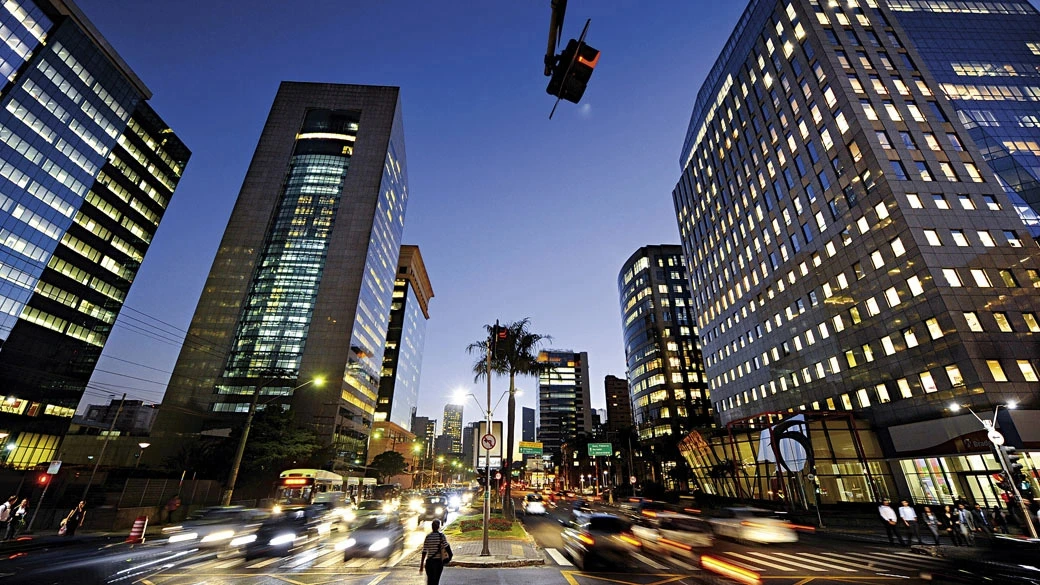
Petrobras and JBS Lead Revenue Charts in Brazil's Second Quarter - Faria Lima.
Petrobras and JBS Lead Revenue Charts in Brazil’s Second Quarter – Faria Lima.
RT
Ask Rio Times
Latin American markets, currencies and companies.
Open the full Ask Rio Times →

Notably, Petrobras faced the steepest revenue fall, followed by Gerdau and Braskem, with declines of 27.7% and 24.9%, respectively.

Conversely, the banking sector flourished, led by Santander Brasil, which soared by 188.8%.

Rede D’Or and Simpar also posted significant gains of 115.6% and 88.7%, respectively. This growth highlights robust sectoral expansion despite broader economic challenges.

The analysis categorizes performance by industry, with notable contributions from banking, oil, refining, meat products, and energy sectors.

It utilizes data from company financial disclosures, analyzing operational net revenue for industries and financial intermediation revenue for banks.

This approach provides a detailed view of the economic forces shaping major Brazilian companies’ performances.

Petrobras and JBS Lead Revenue Charts in Brazil’s Second Quarter

Live Company IntelligencePetroleo Brasileiro Petrobras SA ADR — the full investor dossierInside: live share price, market cap, three-year financials, valuation, ESG and peer benchmarks — plus the latest Rio Times coverage.
P
◆ Live Company Intelligence
Petroleo Brasileiro Petrobras
NYSE: PBRPETR4EnergyOil & Gas Integrated43,199 employees
$134.75B
Market cap
Analyst target $22.38

Wall Street view

4.4Buy/ 5
11 Buy3 Hold0 Sell
Avg. price target $22.38  ·  +29% vs 200-day

Valuation & profitability

Market cap$134.75B
Revenue (TTM)$548.49B
P / E ratio5.5
Profit margin24.3%
Return on equity30.3%

Price & risk

52-wk low
$10.65
52-wk high
$21.99
Beta (volatility)-0.21
200-day average$17.37

Revenue trend · 6y

20202025
Latest $88.10B

Ownership

Institutions22.3%
Shares outstanding3.72B
Top holderGQG Partners LLC
Institutional holders5+ funds

Dividend

Yield16.8%
Payout ratio28.3%
Fwd. annual$1.68
What Petroleo Brasileiro Petrobras does. Petróleo Brasileiro S.A. – Petrobras explores, produces, and sells oil and gas in Brazil, China, the United States, the Americas, Asia, Europe, Singapore, and internationally. It operates through three segments: Exploration and Production; Refining, Transportation & Marketing; and Gas & Low Carbon Energies. The Exploration and Production segment explores, develops, and produces…
Data: RT fundamentals (PBR.US) · figures in USD · as of 17 Sep 2026More company intelligence →

This article was produced by The Rio Times’ automated newsroom system. How we use AI · Report an error

LatAm Markets: Live Signals → — real-time movers, turnover leaders and FX across Latin America.

Read More from The Rio Times

The Rio Times · Power Map
See who really holds power in Latin America
Click to open the Power Map

Rotate for Best Experience

This report is optimized for landscape viewing. Rotate your phone for the full experience.