
Key Facts
—Price. Mexico’s average asking price is 32,682 pesos per square metre (about US$1,757), up 4.3% in a year.
—Month. Asking prices rose 0.6% from September 2026.
—Capital. Mexico City asks 60,222 pesos per square metre (about US$3,238), the highest of 15 states.
—Caveat. These are asking prices from listings, not recorded sale prices.
—As of 12 November 2026, 22:00 GMT
Mexican homes keep getting dearer, but a little more slowly than a year ago. Banorte, one of Mexico’s largest banks, says the national asking price rose 4.3% in a year to 32,682 pesos per square metre (about US$1,757).
What Banorte’s Indicator Shows
Banorte published its monthly housing price indicator for October 2026 on Wednesday 11 November 2026. The indicator, called INBAPREVI (Indicador Banorte de Precios de Vivienda), tracks asking prices per square metre in 15 Mexican states.
The national average asking price reached 32,682 pesos per square metre (about US$1,757 at 18.60 pesos per US$, RT market-data rate, 12 November 2026). That is 4.3% higher than in October 2025 and 0.6% higher than in September 2026.
Banorte’s October 2025 edition showed 31,330 pesos per square metre (about US$1,684 at today’s rate), with annual growth of 4.9%. Annual growth has therefore slowed from 4.9% to 4.3% over the year.
The indicator is built from online property listings, so it shows prices that sellers advertise. It is not a record of completed sales.
Tamaulipas, a northeastern border state, was the cheapest of the 15 states. It also posted the biggest monthly rise, at 1.3%.
Mexico City and the Capital Region
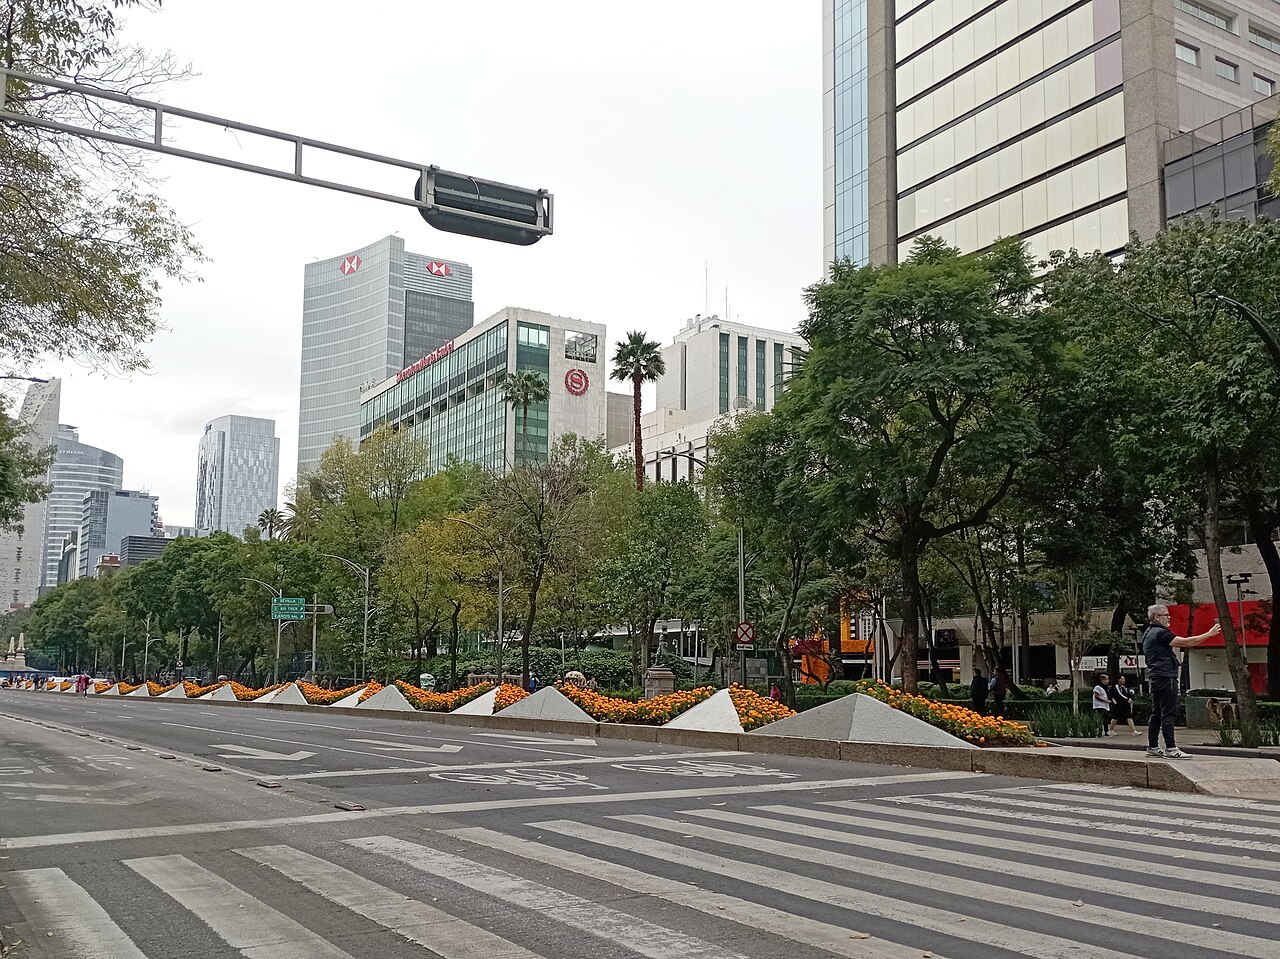
Mexico City, known as CDMX (Ciudad de México), was the most expensive of the states analysed at 60,222 pesos per square metre (about US$3,238). That is 4.2% above a year earlier and 0.7% above the month before.
Apartments made up 78% of the Mexico City listings analysed. The rest were houses.
The State of Mexico, which surrounds the capital, asked 39,355 pesos per square metre (about US$2,116). That is 2.9% more than a year earlier and 0.4% more than the month before.
Apartments were 56.4% of listings there, against 78% in the capital. The mix is more even in the surrounding state.
What It Means for You
Foreign buyers weighing Mexico City would see about US$3,238 per square metre at asking prices. A 70-square-metre flat would then list around 4.2 million pesos (60,222 x 70), about US$227,000.
That sum is simple arithmetic, an illustration and not a market quote. Real listings will differ by neighbourhood and condition.
Prices are in pesos, so the change in US$ terms depends on the exchange rate. We have not calculated a yearly US$ change for that reason.
Related reading: our earlier coverage of Banorte. More is in our Mexico coverage.
What Is Not Known
Asking prices are not sale prices, so buyers may pay more or less than listed. The indicator covers 15 states only, so the national figure is not the whole country.
In the pieces we have, Banorte gives no confirmed reason for the slowdown. We also do not have the full state table.
Inflation context is not used here. The next monthly edition will show whether growth keeps easing.
Frequently Asked Questions
What is the average home asking price in Mexico?
Banorte’s indicator puts it at 32,682 pesos per square metre (about US$1,757) in October 2026. That is 4.3% above October 2025 and 0.6% above September 2026.
How much does Mexico City cost per square metre?
Mexico City averaged 60,222 pesos per square metre (about US$3,238) in asking prices, the highest of 15 states. That is 4.2% more than a year earlier.
Are these actual sale prices?
No. Banorte’s indicator is built from online property listings. It is not a record of completed sales.
Is Mexican home price growth slowing?
Annual growth was 4.3% in October 2026, against 4.9% in Banorte’s October 2025 edition. Banorte has not given us a confirmed reason for the slowdown.
This article was produced by The Rio Times’ automated AI newsroom. Editorial responsibility: Matthias Camenzind, Publisher and Editor-in-Chief. The Rio Times also runs Ask Rio Times, which answers from 100,000+ of our own articles, the daily Latin America Power Map, and prediction-market odds on elections and markets.. How we use AI · Report an error