Soybean Fund Slips 0.7% as Corn Gains 1.22% | Grains, Nov 4

Key Facts
- Soybeans fell for a third straight session, with the soybean-tracking fund SOYB down 0.70% on Wednesday, 4 November 2026, and 7.32% lower over 20 sessions.
- Corn and wheat bounced, with the corn fund CORN up +1.22% and the wheat fund WEAT up 0.27%, but both remain far below their late-summer peaks.
- Wheat is the deepest wound: its tracker closed 21.5% below its 28 August high and is down 11.69% over 20 sessions.
- Brazil’s supply is the main weight, with the government crop agency Conab forecasting 181.6 million tonnes of soybeans for 2026/27 on 49.3 million hectares.
- China is the swing buyer: it is the world’s biggest soybean importer, so its buying pace sets the direction of prices.
- History offers no clear signal: after earlier falls this large, soybeans were higher 20 sessions later in 16 of 29 cases.
Today’s Focus
Soybeans slipped for a third session on Wednesday, 4 November 2026, as the world watched Brazil plant what is forecast to be another giant crop. The soybean-tracking fund SOYB closed at US$25.57, down 0.70%, and stands 9.1% below its 10 September high.
Corn and wheat ended the day slightly higher, but only after heavy monthly losses. The corn fund CORN rose +1.22% to US$17.40, and the wheat fund WEAT gained 0.27% to US$21.99.
The main reason is supply. Brazil, the world’s largest soybean seller, is forecast by Conab, its crop agency, to harvest 181.6 million tonnes in 2026/27, while China’s purchases are already tilted towards Brazilian beans.
What matters today. Cheaper grain helps food importers and feed buyers, while a bumper Brazilian crop leaves exporters leaning on volume rather than price.
01 The session in one read
Grain markets spent Wednesday, 4 November 2026, in two moods. Soybeans sank for a third day in a row, while corn and wheat made small gains.
The split matters because soybeans are the crop most exposed to Brazil and China, the two poles of world trade. Corn and wheat were mostly catching their breath after long slides.
The weight of evidence points to a market well supplied from the southern hemisphere, with China favouring Brazil and prices drifting rather than collapsing. Corn and wheat bounces look like pauses after steep falls rather than turns. The variable to watch is how fast Brazilian planting and Chinese buying progress through November.
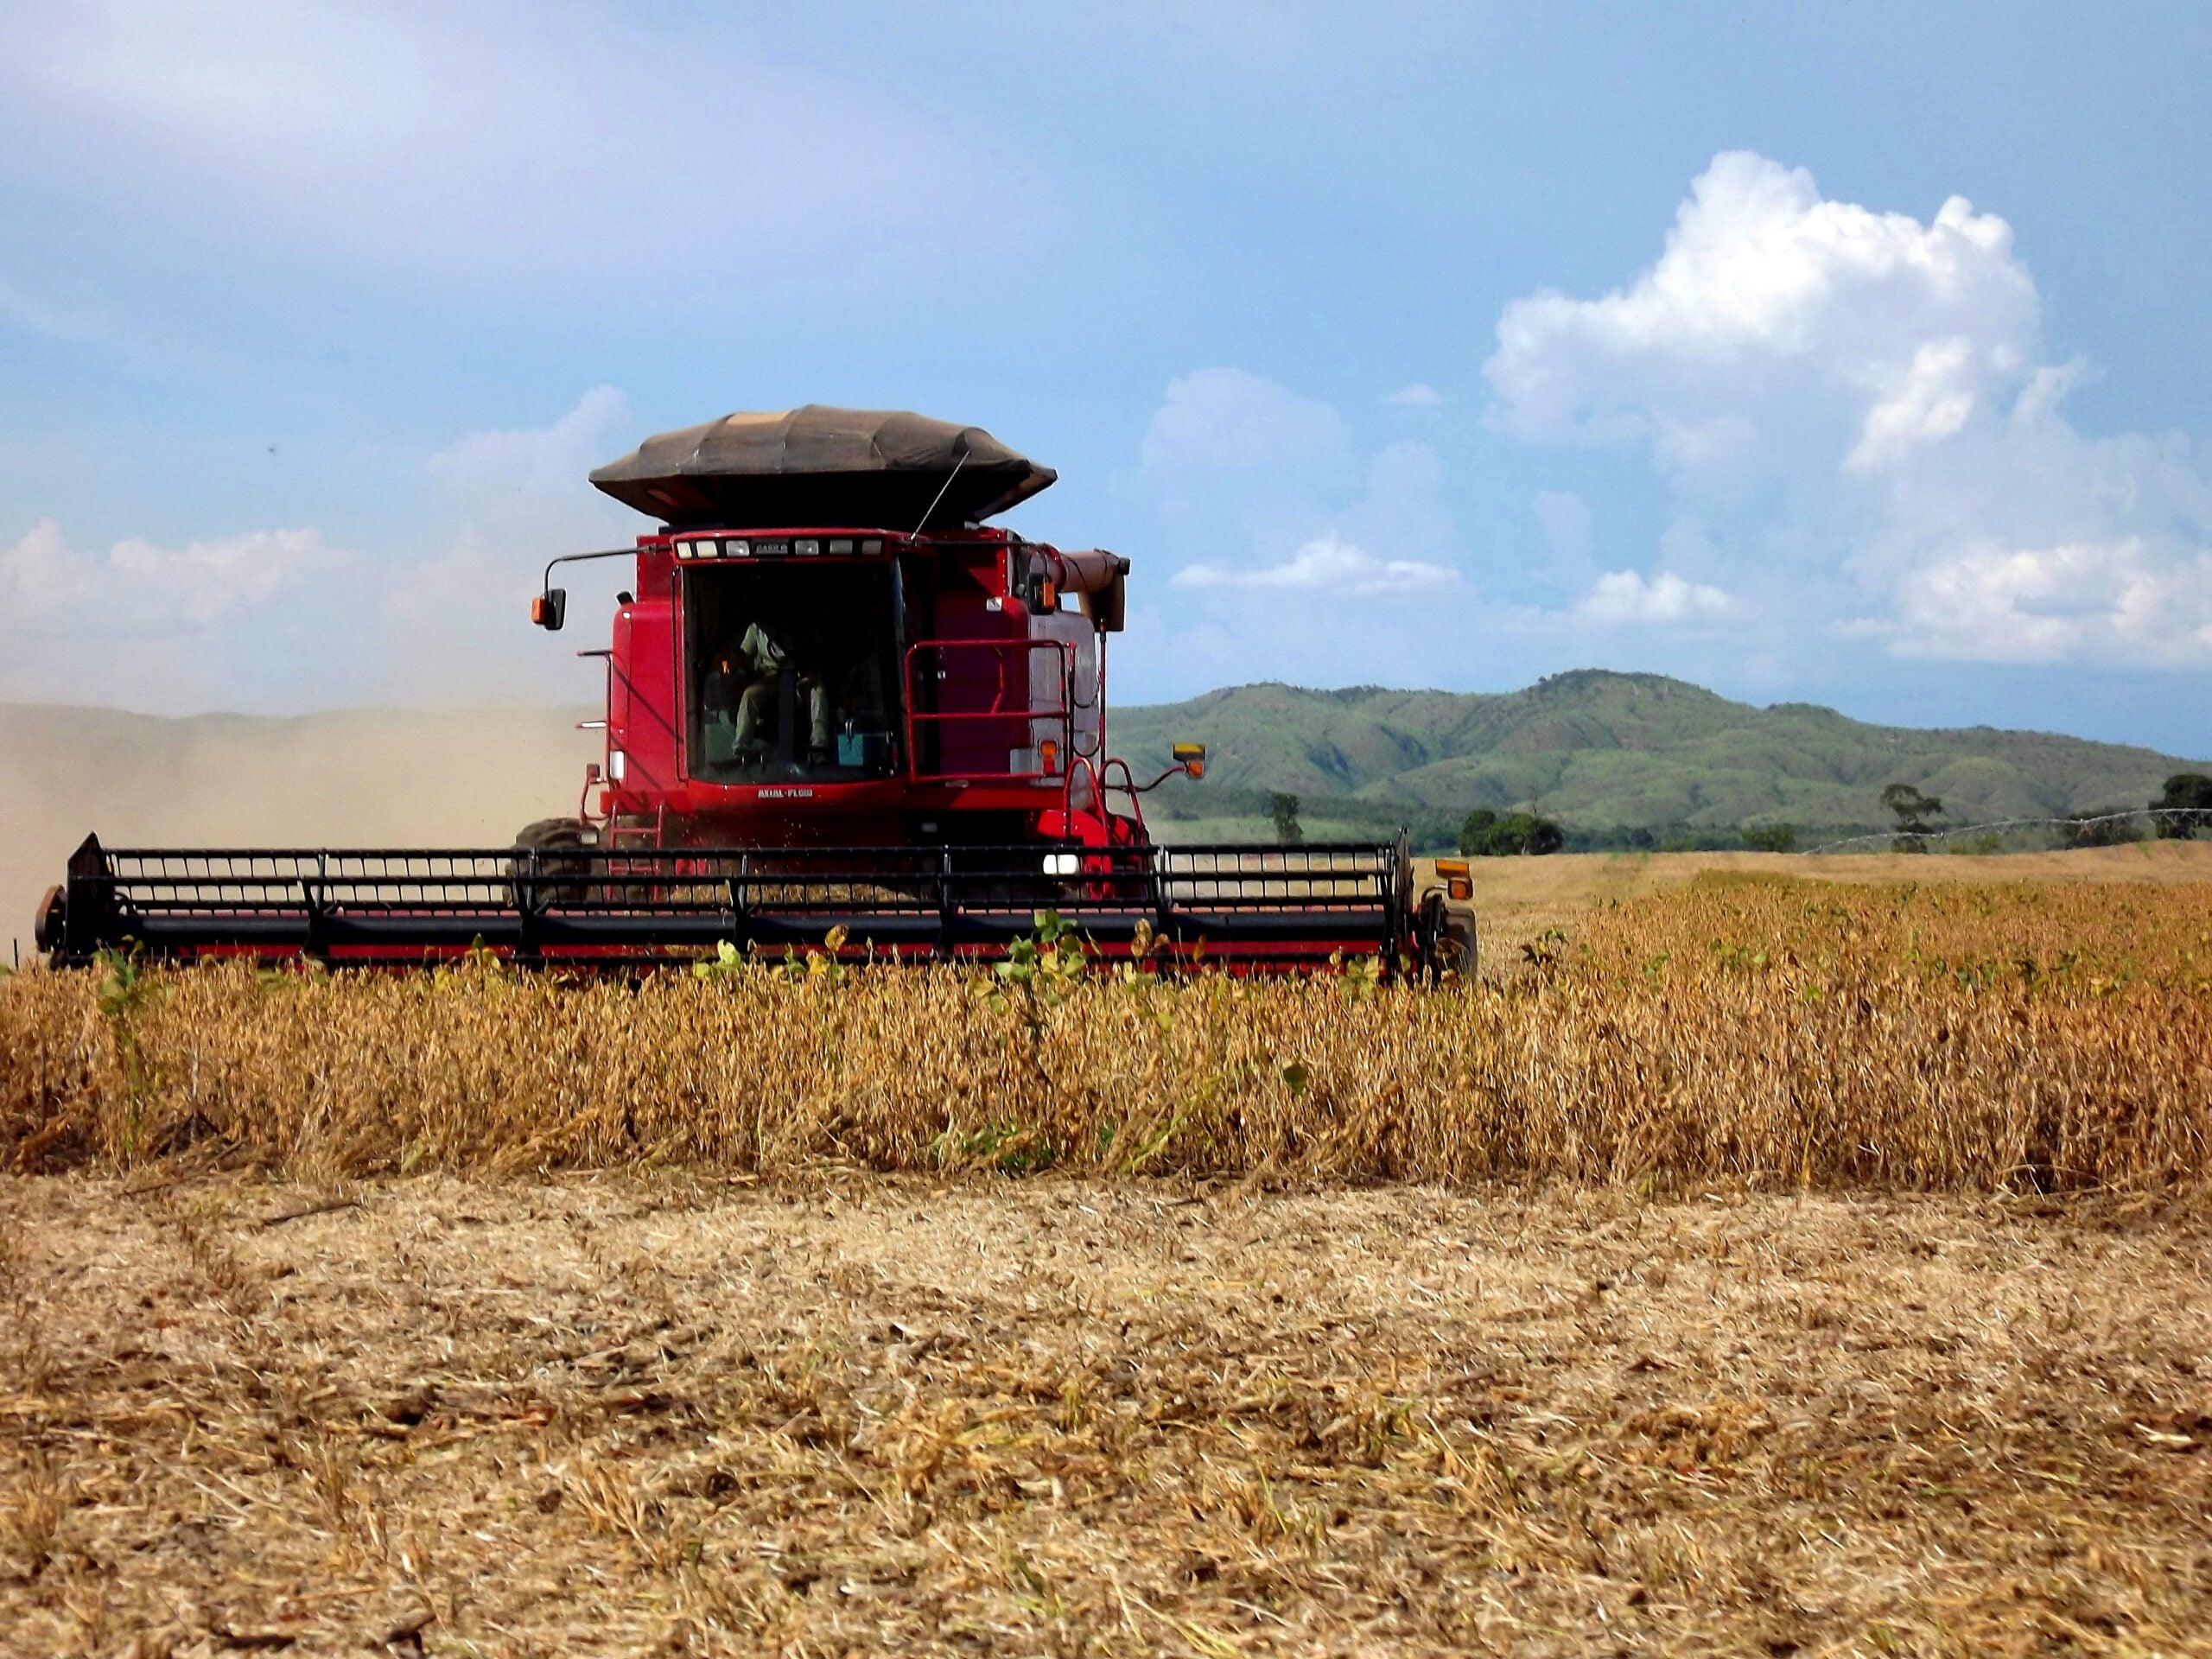
02 The board
The soybean fund fell 0.70%, extending a five-session loss of 1.92%. Over 20 sessions it is down 7.32%, though it is still 2.6% higher than 60 sessions ago.
Corn rose +1.22% yet is 8.66% lower over 20 sessions. Wheat added 0.27% but has dropped 11.69% over the same stretch.
| Asset | Level | Change |
|---|---|---|
| Soybeans (SOYB) | US$25.57 | -0.70% |
| Corn (CORN) | US$17.40 | +1.22% |
| Wheat (WEAT) | US$21.99 | +0.27% |
Source: RT close, 2026-11-04. Where a commodity has no spot feed, an exchange-traded tracker or leading producer is shown as a labelled proxy.
Live Market IntelligenceThe live market board
Rio Times · Live Market Intelligence
Latin America — Cross-Market Board
| Instrument | Last | Change | YoY | Prev. | High | Low | Volume |
|---|---|---|---|---|---|---|---|
| IBOV | 167,563.47 | +1.23% | +19.56% | 165,528.92 | 178,526 | 175,157 | — |
| IPSA | 10,627.00 | +2.52% | — | 10,366.16 | 10,722 | 10,633 | — |
| IPC MEX | 71,385.90 | +1.71% | +12.74% | 70,184.33 | 70,008 | 69,383 | 49,372,306 |
| MERVAL | 2,848,945 | — | +12.65% | 2,859,051 | — | — | — |
| COLCAP | 2,506.42 | -0.84% | — | — | — | — | — |
| USD/BRL | 5.34 | -1.32% | -0.84% | 5.42 | 5.42 | 5.30 | — |
| EUR/BRL | 5.95 | +7.53% | -4.87% | 5.54 | 6.04 | 5.92 | — |
| USD/MXN | 18.69 | +0.62% | +1.45% | 18.57 | 18.69 | 18.54 | — |
| USD/CLP | 983.47 | -0.57% | +5.64% | 989.13 | 991.87 | 979.07 | — |
| USD/COP | 3,149 | +3.06% | -18.02% | 3,056 | 3,173 | 3,111 | — |
| USD/PEN | 3.45 | +0.17% | +3.85% | 3.44 | 3.45 | 3.44 | — |
| USD/ARS | 1,537 | -0.28% | +3.77% | 1,541 | 1,541 | 1,537 | — |
| USD/UYU | 40.21 | +3.57% | +2.29% | 38.83 | 40.21 | 40.08 | — |
| USD/PYG | 5,803 | +3.78% | -16.54% | 5,592 | 5,803 | 5,735 | — |
| USD/BOB | 11.97 | +4.93% | +77.92% | 11.41 | 11.97 | 11.82 | — |
| USD/DOP | 60.54 | +1.83% | -4.34% | 59.45 | 61.14 | 59.85 | — |
| USD/CRC | 451.24 | +2.13% | -7.80% | 441.83 | 451.40 | 450.04 | — |
| USD/GTQ | 7.64 | +3.23% | +2.18% | 7.40 | 7.64 | 7.64 | — |
03 Why it moved
The first and heaviest cause is Brazilian supply. Conab forecasts 181.6 million tonnes of soybeans from 49.3 million hectares, with area up 1.4%, and exports of about 118 million tonnes. Confidence: medium-high.
The second cause is China, the world’s biggest soybean buyer, which leans heavily on Brazilian beans. Its buying pace is the swing factor for prices. Confidence: medium.
The usual drivers were mixed. The dollar index eased 0.37% to 101.49, and the 10-year Treasury yield fell 5 basis points to 4.90%, which normally supports commodities. Oil’s fund USO fell 8.07% and the S&P 500 rose 1.58%, so broad markets were not fleeing risk. That suggests grain-specific supply, not macro stress, drove soybeans. Confidence: medium.
04 The trend behind it
Soybeans peaked on 10 September and have since lost 9.1% from that high. They are still 17.8% above the 12-month low reached on 13 January, so this is a pullback inside a higher range rather than a collapse.
Corn is 14.2% below its 1 September high and 5.6% above its 29 June low. Wheat is 21.5% below its 28 August high, the sharpest retreat of the three; the year-ago low in the data is a distortion of the fund’s history, so ignore the 428.6% figure.
Our own history adds perspective. After earlier falls as large as soybeans’ recent one, the fund was higher 20 sessions later in 16 of 29 cases, a median gain of 0.6% and a worst loss of 7.8%. For corn it was higher in 13 of 30 cases, median loss 0.7%; for wheat 7 of 20, median loss 1.8%. History is not a forecast.
05 What it means for Latin America
Brazil gains in volume but not necessarily in price. A larger crop and exports of about 118 million tonnes help farmers, traders and ports, yet softer prices squeeze margins for growers who buy fertiliser and machinery in dollars.
Argentina, the other great exporter, faces the same pressure from lower prices, though we could not verify fresh Argentine crop data. Importers such as Mexico and Chile, which buy corn and wheat, benefit from cheaper feed and flour.
06 The names to watch
SOYB, CORN and WEAT are exchange-traded funds that track soybean, corn and wheat futures, so they are proxies and not the crops’ own prices. Soybeans are the one to follow for Brazil and China.
Corn matters for livestock feed and ethanol, and wheat for bread prices. Wheat has the biggest drawdown, so any rebound there would be the clearest sign of bargain-hunting.
07 What would end it
For soybeans, the nearest support is the 21.71 low from 13 January, while resistance sits at the 28.14 high from 10 September. Corn’s markers are 16.47 and 20.29, and wheat’s is the 28.00 high.
Weather problems in Brazil’s planting, a surge in Chinese buying of American beans or a US-China tariff change would turn the picture. Without them, the drift lower is more likely to continue than reverse, though the base rates show it is close to a coin toss.
08 What to watch
- Brazil planting: Pace of sowing in Mato Grosso and other states, since delays would tighten supply.
- China purchases: Whether Beijing keeps booking Brazilian beans or returns to US cargoes.
- US-China trade: Any change in China’s tariffs on American soybeans.
- Support levels: Soybeans at 21.71, corn at 16.47, and wheat’s retreat from 28.00.
Frequently Asked Questions
Why did soybeans fall?
Large Brazilian supply forecasts and China’s early buying of Brazilian beans weighed on prices, while the dollar and yields offered little pressure.
Do these funds show spot prices?
No. SOYB, CORN and WEAT track futures and are proxies for the crops.
Who benefits from cheaper grain?
Importers and livestock feeders benefit, while exporters and farmers face thinner margins.
Will prices keep falling?
Our history shows roughly even odds after similar falls, so it is not a reliable forecast.
Market data: The Rio Times
This article was produced by The Rio Times’ automated newsroom system. How we use AI · Report an error · Editorial responsibility: Matthias Camenzind, Editor-in-Chief
LatAm Markets: Live Signals → — real-time movers, turnover leaders and FX across Latin America.