Corn and Wheat Hit 3-Month Lows as Soy Slides | Grains Wrap, Nov 5
Key Facts
- Corn hit its lowest close in at least 3 months: the corn-tracking fund ended at US$17.15 (-1.44%), which is 15.5% below its 1 September peak of 20.29.
- Soybeans fell for a fourth session in a row: the soybean fund closed at US$25.30 (-1.06%) and is 7.63% lower than 20 sessions ago.
- Wheat also touched a 3-month low: the wheat fund ended at US$21.93 (-0.27%), which is 21.7% below its 28 August high of 28.00.
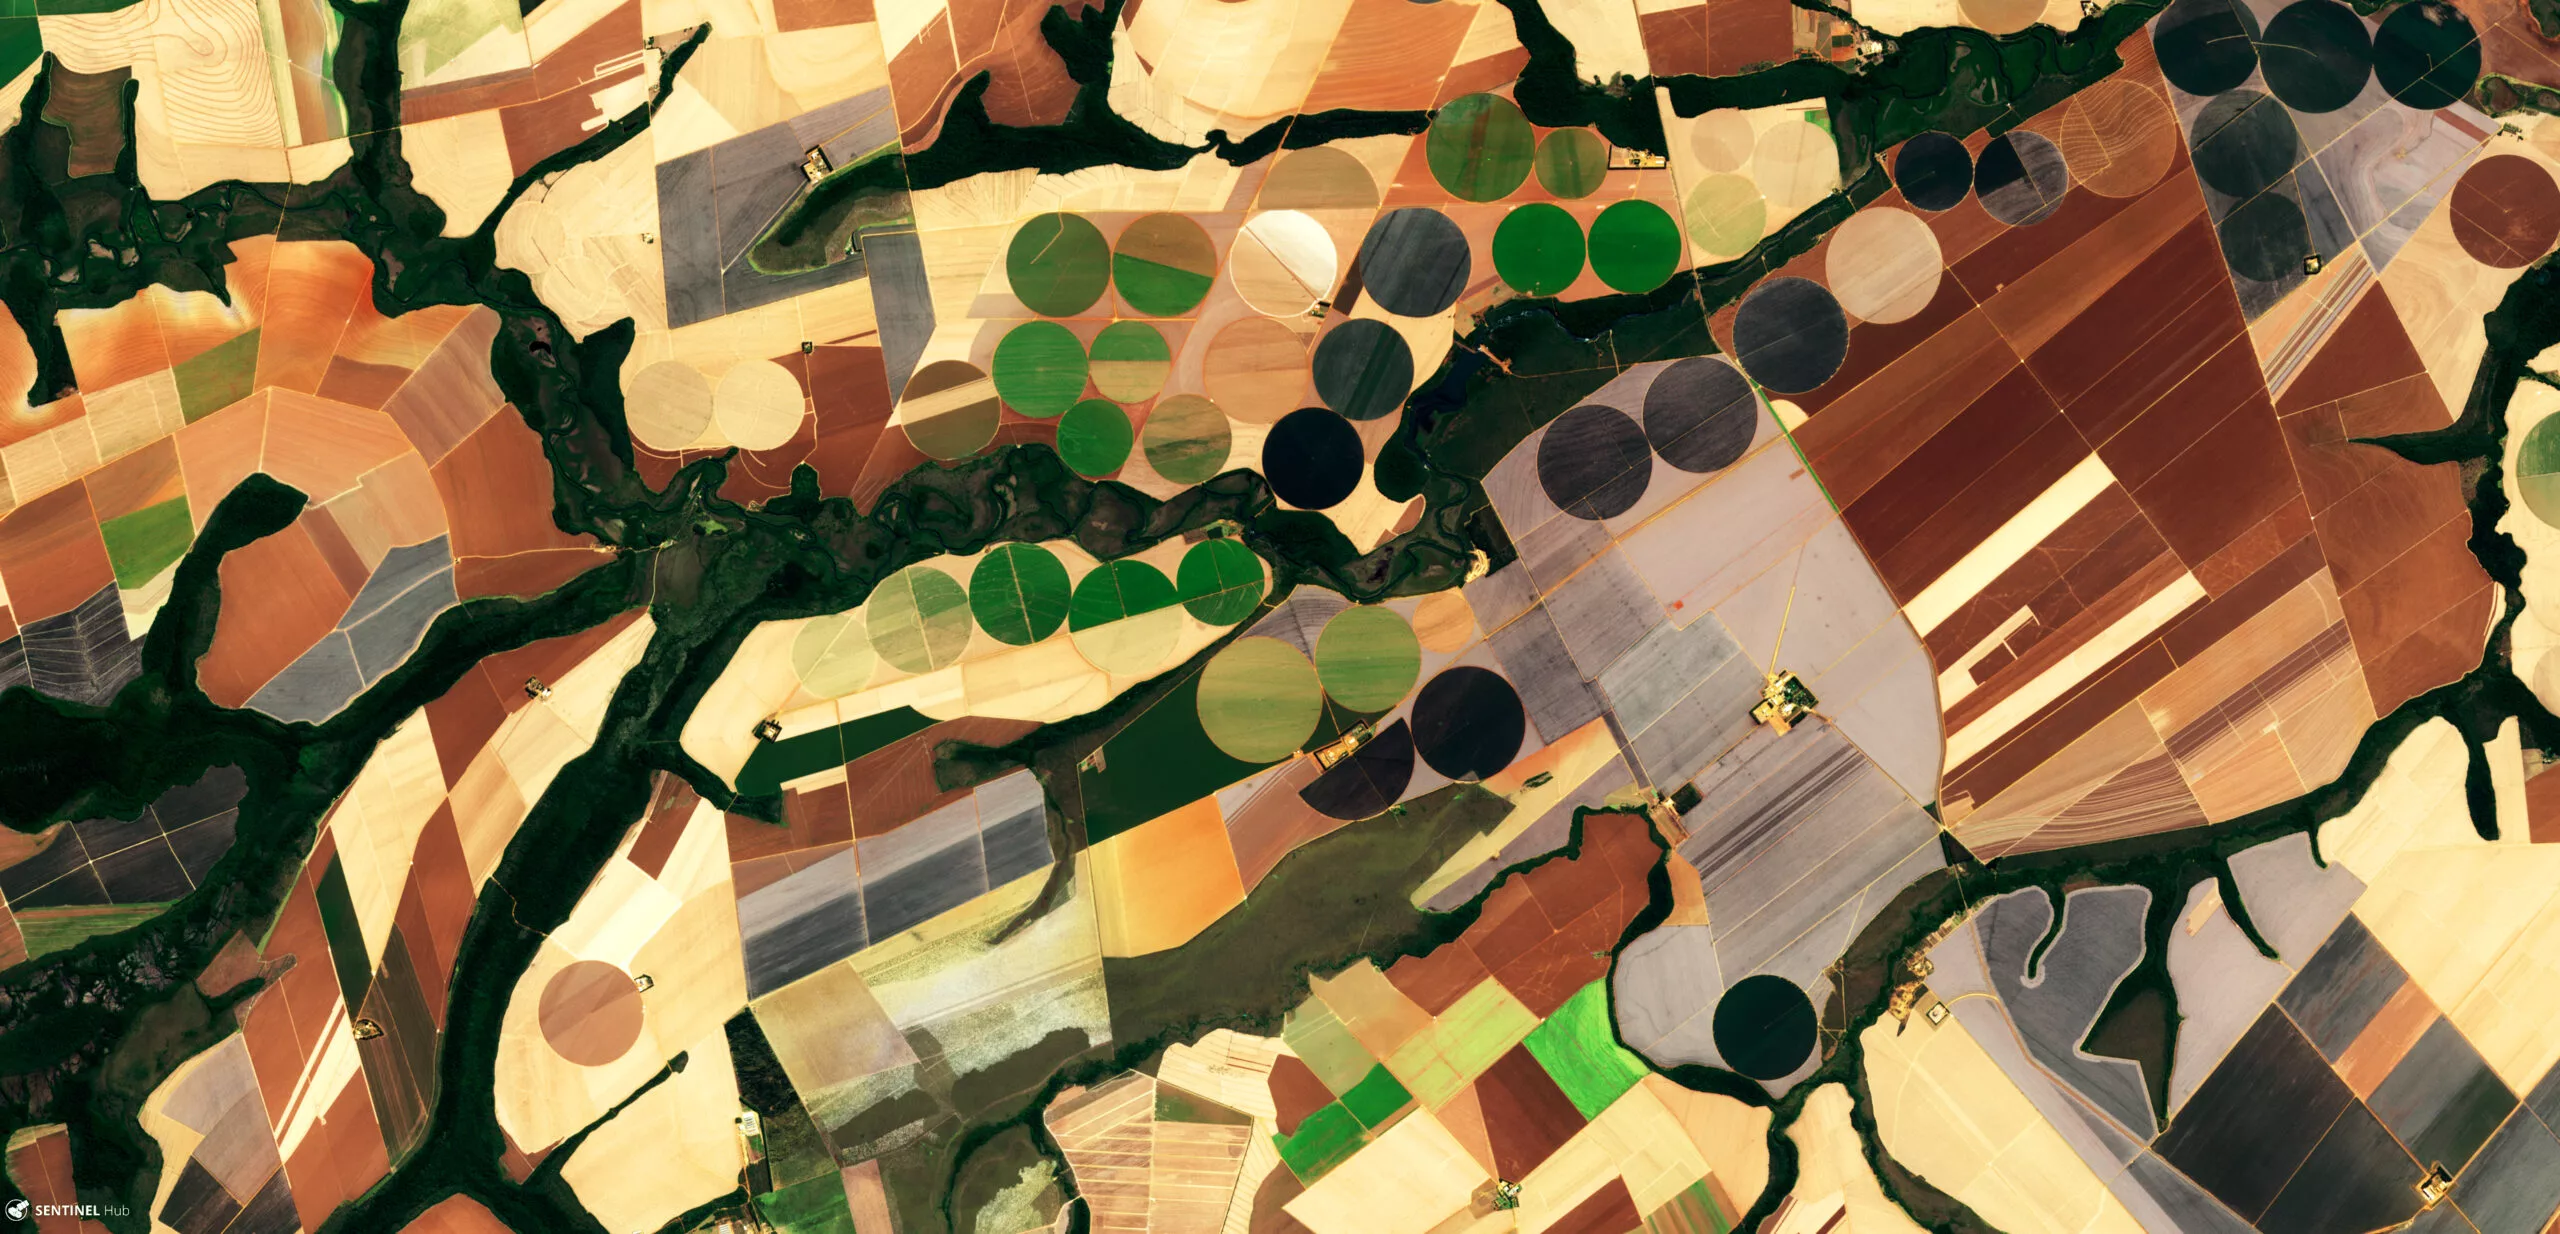
- Brazil is the main weight on prices: the crop agency Conab projects a record 181.64 million tonnes of soybeans for 2026/27, up 0.7% on the year before.
- Fear spread beyond farming: the S&P 500 fell 4.36% and the VIX fear gauge jumped 69.66% to 28.18, which pushed funds to sell raw materials.
- History offers a mild comfort for soybeans: after 26 earlier falls this large, soybeans were higher 20 sessions later in 17 cases, though history is not a forecast.
Today’s Focus
Grain prices fell together on Thursday, November 5, 2026, and corn and wheat reached their lowest closes in at least three months. The corn-tracking fund finished at US$17.15, while the soybean fund fell for a fourth day running to US$25.30.
The main reason is supply. Brazil, the world’s biggest soybean exporter, is heading for another record crop, and that is arriving just as a wider stock-market fright pushed investors to sell almost everything with a price.
Wheat was the steadiest of the three, down only 0.27%, but it has fallen furthest over the past month. The wheat fund is 11.43% lower than 20 sessions ago.
What matters today. Cheaper grain helps food importers and hurts Latin American farm exporters, and Brazil’s harvest decides how far prices can fall.
01 The session in one read
Think of the grain market as a very large warehouse that is filling faster than expected. On Thursday, November 5, 2026, three tracking funds all closed lower, and corn and wheat sank to their weakest levels in at least three months.
These funds hold futures, which are contracts to buy grain at a set price on a later date. They are stand-ins for the crops, not the crops’ own prices.
The best-supported reading is that a record Brazilian crop set the direction, and a sharp risk-off day in equities made the fall bigger. We hold this with medium confidence, because the dollar was flat and bond yields eased, which normally helps grain prices, so something else must have outweighed them. The variable to watch is the pace of Brazilian planting, which is behind last year.
02 The board
Soybeans led by persistence. The soybean fund fell 1.06% to US$25.30, its fourth straight decline, and it has lost 3.10% over five sessions.
Corn dropped most on the day, at -1.44%, to US$17.15. Wheat slipped only 0.27% to US$21.93, which fits market reports that wheat held up better than its neighbours.
| Asset | Level | Change |
|---|---|---|
| Soybeans (SOYB) | US$25.30 | -1.06% |
| Corn (CORN) | US$17.15 | -1.44% |
| Wheat (WEAT) | US$21.93 | -0.27% |
Source: RT close, 2026-11-05. Where a commodity has no spot feed, an exchange-traded tracker or leading producer is shown as a labelled proxy.
Live Market IntelligenceThe live market board
Rio Times · Live Market Intelligence
Latin America — Cross-Market Board
| Instrument | Last | Change | YoY | Prev. | High | Low | Volume |
|---|---|---|---|---|---|---|---|
| IBOV | 166,191.45 | -0.82% | +8.41% | 167,563.47 | 168,994 | 166,190 | — |
| IPSA | 10,465.26 | -1.52% | — | 10,627.08 | 10,741 | 10,346 | — |
| IPC MEX | 71,033.20 | +0.30% | +12.16% | 70,819.80 | 71,422 | 70,331 | 182,333,478 |
| MERVAL | 2,848,945 | — | -6.54% | 2,859,051 | — | — | — |
| COLCAP | 2,484.43 | -0.88% | — | — | — | — | — |
| USD/BRL | 5.49 | +0.51% | +2.40% | 5.46 | 5.49 | 5.49 | — |
| EUR/BRL | 6.17 | +0.44% | +0.25% | 6.14 | 6.17 | 6.16 | — |
| USD/MXN | 18.74 | +0.65% | +0.81% | 18.62 | 18.79 | 18.71 | — |
| USD/CLP | 977.69 | +1.16% | +3.63% | 966.50 | 977.69 | 977.69 | — |
| USD/COP | 3,230 | -0.63% | -15.73% | 3,250 | 3,230 | 3,230 | — |
| USD/PEN | 3.44 | -0.08% | +3.83% | 3.44 | 3.44 | 3.44 | — |
| USD/ARS | 1,545 | -0.19% | +6.46% | 1,548 | 1,547 | 1,544 | — |
| USD/UYU | 40.22 | +3.24% | +2.50% | 38.96 | 40.26 | 40.22 | — |
| USD/PYG | 6,358 | +9.88% | -8.70% | 5,787 | 6,358 | 6,031 | — |
| USD/BOB | 11.92 | +1.74% | +77.02% | 11.72 | 12.00 | 11.92 | — |
| USD/DOP | 59.79 | -1.17% | -6.65% | 60.50 | 59.79 | 59.79 | — |
| USD/CRC | 449.63 | +2.27% | -8.18% | 439.66 | 450.45 | 448.95 | — |
| USD/GTQ | 7.64 | +3.16% | +2.07% | 7.41 | 7.64 | 7.64 | — |
03 Why it moved
First and heaviest is the supply picture. Conab, Brazil’s official crop agency, forecasts a record 181.64 million tonnes of soybeans for 2026/27 and a record 367.1 million tonnes of all grains, so buyers see no need to pay up.
Second is China, the biggest buyer of soybeans. Under its trade deal with Washington, China pledged to buy at least 25 million tonnes of US soybeans a year through 2028, but it had already met its 12 million tonne pledge for late 2025 and turned to Brazil.
Cheaper South American supply keeps American prices under pressure, and the American corn harvest is now bringing in new supply.
Third is fear. The S&P 500 fell 4.36% on the day and the VIX rose to 28.18, so funds sold broadly.
The usual drivers disagree with the move: the dollar index was unchanged at 101.56 and the 10-year Treasury yield eased to 4.85%. Our confidence in the ranking is medium, because positioning data for the day is not yet available.
04 The trend behind it
This is a continuation, not a fresh turn. The soybean fund is 10.1% below its 10 September high of 28.14, and 16.5% above its January low of 21.71.
Corn is the weakest of the three, 9.55% lower than 20 sessions ago and only 4.1% above its 29 June low of 16.47. Wheat is 10.0% lower than 60 sessions ago, so its slide began earlier than the others.
05 What it means for Latin America
Brazil and Argentina are the world’s export engine, so lower prices cut what farmers earn per tonne even as the harvest grows. Conab expects planting on 49.3 million hectares, up 1.4%, so Brazilian growers will sell more beans at lower prices.
Argentina is more exposed, because its government taxes soybean exports. It suspended its export levy briefly in September 2025, and Chinese buyers booked at least 10 cargoes within days before the tax returned.
For importers such as Mexico, which buys large amounts of US corn, cheaper grain eases feed and tortilla costs. The Brazilian real tends to follow crop income, so weak grain adds a small drag, though we found no real exchange-rate figure for this session.
06 The names to watch
The three funds are the quick gauges: SOYB for soybeans, CORN for corn and WEAT for wheat. Each tracks futures, so they can differ from local farm prices.
On the ground, watch Conab’s monthly reports, which carry the official planting and crop estimates.
07 What would end it
The nearest floors are the corn low of 16.47 and the soybean January low of 21.71, while the upside hurdles are the September highs, 28.14 for soybeans and 20.29 for corn. A close below 16.47 would mark a new 12-month low for corn.
Our own price history gives a measured answer. After 26 earlier soybean falls this large, soybeans were higher 20 sessions later in 17 cases (65%), with a median gain of 0.6% and a worst loss of 7.8%.
For corn, 15 of 27 cases (56%) were higher, with a median gain of 0.5% and a worst loss of 8.4%. For wheat, only 8 of 21 (38%) were higher, with a median loss of 0.9% and a worst loss of 25.3%; history is not a forecast.
What would end the slide is a weather scare or slow Brazilian planting, or new Chinese buying. Without one of those, the harvest keeps the pressure on.
08 What to watch
- Brazil planting: Conab’s monthly planting and crop estimates; delays or El Niño weather problems would cut crop estimates and lift prices.
- China buying: Fresh purchases of US or Brazilian soybeans against the 25 million tonne annual pledge.
- Equity fear: If the VIX stays near 28.18, funds may keep selling grains along with other assets.
- Corn floor: The 29 June low of 16.47 is the line that matters for the corn-tracking fund.
Frequently Asked Questions
Why did grain prices fall on Thursday, November 5, 2026?
Mainly because Brazil is expected to harvest a record soybean crop, and because a sharp stock-market sell-off pushed funds to sell raw materials.
Do the funds show the actual grain price?
No. SOYB, CORN and WEAT track futures contracts, so they are proxies and not the price of the grain itself.
Who gains from cheaper grain?
Food and feed importers and consumers gain, while Brazilian and Argentine farmers earn less per tonne.
Is this the bottom?
Unknown, but in our history soybeans rose 20 sessions later in 65% of similar falls. Corn did so in 56% of cases and wheat in 38%, and none of this is a forecast.
Market data: The Rio Times
This article was produced by The Rio Times’ automated newsroom system. How we use AI · Report an error · Editorial responsibility: Matthias Camenzind, Editor-in-Chief
LatAm Markets: Live Signals → — real-time movers, turnover leaders and FX across Latin America.