IBOV 183,476.86 ▼ 0.27% IPSA 11,256.80 ▼ 0.38% IPC MEX 64,992.23 ▲ 1.13% MERVAL 2,893,751 ▼ 1.57% COLCAP 2,584.72 ▼ 0.95% BVL PERÚ 59,934.37 ▲ 1.27% USD/BRL5.19▼ 0.12% USD/MXN17.68▼ 0.27% USD/CLP960.63▼ 0.27% USD/COP3,293▲ 0.20% USD/PEN3.39▼ 0.67% USD/ARS1,525▲ 0.30% USD/UYU40.21▲ 3.50% USD/PYG5,870▲ 2.23% USD/BOB12.17▲ 2.05% USD/DOP59.35▲ 0.25% USD/CRC450.87▲ 2.53% USD/GTQ7.64▲ 3.22% USD/HNL26.85▲ 0.31% USD/NIO36.62▲ 2.66% USD/VES853.52▼ 0.13% USD/PAB1.00— 0.00% USD/BZD2.00— 0.00% USD/JMD 157.28 — 0.00% USD/TTD6.77▲ 2.72% EUR/BRL5.91▲ 0.63% BRENT 88.88 ▼ 0.03% WTI 83.11 ▼ 0.11% IRON ORE 161.91 — — COPPER 6.61 ▲ 0.03% GOLD 4,461 ▲ 1.78% SILVER 65.59 ▲ 1.26% SOY 1,184 ▲ 3.20% CORN 480.50 ▲ 10.02% WHEAT 655.00 ▲ 3.93% COFFEE 317.25 ▼ 5.51% SUGAR 16.43 ▼ 1.79% ORANGE JUICE 138.55 ▼ 0.47% COTTON 85.03 ▲ 2.33% COCOA 5,719 ▲ 3.18% BEEF 223.60 ▼ 3.93% CATTLE 339.10 ▼ 3.16% LITHIUM 75.20 ▲ 1.47% PETR4 41.64 ▼ 0.05% VALE3 72.97 ▲ 0.83% ITUB4 38.60 ▼ 1.03% BBDC4 16.85 ▲ 0.36% ABEV3 14.89 ▼ 0.80% BBAS3 19.37 ▲ 0.47% B3SA3 14.26 ▼ 0.21% WEGE3 47.59 ▲ 0.49% PRIO3 59.14 ▼ 0.19% SUZB3 41.33 ▲ 2.35% RENT3 34.68 ▼ 0.09% AZZA3 15.89 ▼ 2.63% CSAN3 3.22 ▼ 1.83% RAIZ4 0.25 — 0.00% PCAR3 2.75 ▼ 0.36% GMAT3 3.65 ▼ 1.08% PSSA3 48.13 ▼ 0.54% CVCB3 1.33 ▼ 2.92% POSI3 3.36 ▲ 2.44% SLCE3 13.34 ▲ 0.30% NATU3 8.14 ▼ 0.73% IBOV 183,476.86 ▼ 0.27% IPSA 11,256.80 ▼ 0.38% IPC MEX 64,992.23 ▲ 1.13% MERVAL 2,893,751 ▼ 1.57% COLCAP 2,584.72 ▼ 0.95% BVL PERÚ 59,934.37 ▲ 1.27% USD/BRL 5.16 ▲ 0.01% USD/MXN 17.06 ▼ 0.24% USD/CLP 913.98 ▲ 0.04% USD/COP 3,140 ▲ 0.03% USD/PEN 3.36 ▼ 0.66% USD/ARS 1,493 ▲ 0.10% USD/UYU 40.27 ▲ 1.24% USD/PYG 5,939 ▲ 1.68% USD/BOB 11.64 ▼ 0.76% USD/DOP 58.34 ▲ 1.25% USD/CRC 445.92 ▲ 0.89% USD/GTQ 7.62 ▲ 2.21% USD/HNL 26.79 ▲ 1.57% USD/NIO 36.62 ▲ 0.69% USD/VES 762.44 ▼ 0.13% USD/PAB 1.00 — 0.00% USD/BZD 2.00 — 0.00% USD/JMD 157.28 — 0.00% USD/TTD 6.70 ▲ 0.61% EUR/BRL 5.95 ▲ 1.01% BRENT 88.88 ▼ 0.03% WTI 83.11 ▼ 0.11% IRON ORE 161.91 — — COPPER 6.61 ▲ 0.03% GOLD 4,461 ▲ 1.78% SILVER 65.59 ▲ 1.26% SOY 1,184 ▲ 3.20% CORN 480.50 ▲ 10.02% WHEAT 655.00 ▲ 3.93% COFFEE 317.25 ▼ 5.51% SUGAR 16.43 ▼ 1.79% ORANGE JUICE 138.55 ▼ 0.47% COTTON 85.03 ▲ 2.33% COCOA 5,719 ▲ 3.18% BEEF 223.60 ▼ 3.93% CATTLE 339.10 ▼ 3.16% LITHIUM 75.20 ▲ 1.47% PETR4 41.64 ▼ 0.05% VALE3 72.97 ▲ 0.83% ITUB4 38.60 ▼ 1.03% BBDC4 16.85 ▲ 0.36% ABEV3 14.89 ▼ 0.80% BBAS3 19.37 ▲ 0.47% B3SA3 14.26 ▼ 0.21% WEGE3 47.59 ▲ 0.49% PRIO3 59.14 ▼ 0.19% SUZB3 41.33 ▲ 2.35% RENT3 34.68 ▼ 0.09% AZZA3 15.89 ▼ 2.63% CSAN3 3.22 ▼ 1.83% RAIZ4 0.25 — 0.00% PCAR3 2.75 ▼ 0.36% GMAT3 3.65 ▼ 1.08% PSSA3 48.13 ▼ 0.54% CVCB3 1.33 ▼ 2.92% POSI3 3.36 ▲ 2.44% SLCE3 13.34 ▲ 0.30% NATU3 8.14 ▼ 0.73%
since 2009
Saturday, September 26, 2026

China Agri Business

China’s Surprising Soybean Meal Boom: Why It Matters to the Global Market

By · May 30, 2024 · 2 min read

The LatAm Brief

One email, every weekday morning. What moved in Latin American markets, politics and expat life.

Yesterday’s subject line: “The US Army is quietly planning for Cuba”

Free. We send a confirmation link first — nothing arrives until you click it. Unsubscribe with one click in any edition. If you stop opening us for 30 days we stop sending by ourselves, as we assume the interest is no longer there. See our privacy policy. We never share your email.

China is exporting record amounts of soybean meal. This increase follows a drop in domestic pork demand and a shrinking pig population.

Consequently, soybean processors are finding new markets for their excess animal feed.

China’s export surge reveals big shifts in its economy and global trade. Known as the world’s largest agricultural importer, China buys vast quantities of soybeans.

These soybeans feed its immense pig herds and provide pork to millions of families. Pork is China’s most-consumed animal protein.

China imports most of its soybeans from South America, especially Brazil, and the United States. These soybeans are processed into meals for animal feed and oil for cooking.
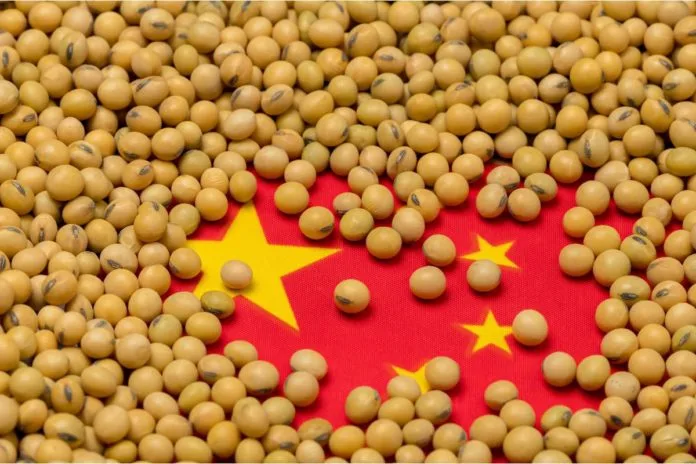
China’s Surprising Soybean Meal Boom: Why It Matters to the Global Market
China’s Surprising Soybean Meal Boom: Why It Matters to the Global Market.
One-stop reference
Company Intelligence
Every listed company in Latin America — financials, ownership and structure for 1,450+ companies across 26 exchanges, in one place.
Browse the directory →
RT
Ask Rio Times
Latin American markets, currencies and companies.
Open the full Ask Rio Times →

Recently, consumer spending has dropped due to tighter budgets. Farmers have also reduced their herds because of low pork prices.

This situation has caused local soybean meal prices to hit three-year lows. Meanwhile, soybean meal exports have soared to nearly 600,000 tons in the first four months of 2024.

This is almost five times higher than the previous year. Export destinations include Japan and the United Kingdom.

China’s move to export more soybean meal won’t drastically cut demand from major South American exporters. Last year, Argentina and Brazil each exported over 20 million tons of soybean meal.

Navigating Soybean Market Dynamics

The future of Chinese exports depends on soybean meal prices and supplies in the exporting countries. The reduced pig population in China also plays a crucial role.

Typically, China’s soybean imports rise mid-year. Chinese crushers must consider the impact of heavy rains in Rio Grande do Sul on South American crops.

They also watch for rising tensions between Beijing and Washington, which could influence supply chains.

Understanding this shift matters because it shows China’s influence on global agricultural markets.

Changes in Chinese demand can ripple through international trade, affecting prices and supplies worldwide.

As China navigates these challenges, its strategies will continue to impact global markets and trade dynamics.

China’s response to domestic and international pressures will shape future agricultural trade, making this a critical issue for the global economy.

This article was produced by The Rio Times’ automated newsroom system. How we use AI · Report an error

Read More from The Rio Times

The Rio Times · Power Map
See who really holds power in Latin America
Click to open the Power Map →

Rotate for Best Experience

This report is optimized for landscape viewing. Rotate your phone for the full experience.