IBOV 185,229.17 ▼ 0.41% IPSA 11,381.18 ▲ 1.30% IPC MEX 63,706.89 ▼ 0.26% MERVAL 3,021,926 ▼ 1.29% COLCAP 2,548.22 ▲ 1.05% BVL PERÚ 60,023.65 ▼ 1.13% USD/BRL5.14▲ 0.26% USD/MXN17.22▲ 0.30% USD/CLP959.00▼ 0.31% USD/COP3,175▲ 1.37% USD/PEN3.37▼ 0.10% USD/ARS1,514▲ 0.26% USD/UYU40.16▲ 2.90% USD/PYG5,906▲ 2.95% USD/BOB9.95▼ 6.56% USD/DOP58.83▲ 0.22% USD/CRC444.45▲ 2.49% USD/GTQ7.63▲ 3.03% USD/HNL26.85▲ 0.38% USD/NIO36.62▲ 0.26% USD/VES846.42▼ 0.13% USD/PAB1.00— 0.00% USD/BZD2.00— 0.00% USD/JMD 157.28 — 0.00% USD/TTD6.75▲ 2.57% EUR/BRL5.91▲ 0.04% BRENT 88.88 ▼ 0.03% WTI 83.11 ▼ 0.11% IRON ORE 161.91 — — COPPER 6.61 ▲ 0.03% GOLD 4,461 ▲ 1.78% SILVER 65.59 ▲ 1.26% SOY 1,184 ▲ 3.20% CORN 480.50 ▲ 10.02% WHEAT 655.00 ▲ 3.93% COFFEE 317.25 ▼ 5.51% SUGAR 16.43 ▼ 1.79% ORANGE JUICE 138.55 ▼ 0.47% COTTON 85.03 ▲ 2.33% COCOA 5,719 ▲ 3.18% BEEF 223.60 ▼ 3.93% CATTLE 339.10 ▼ 3.16% LITHIUM 75.20 ▲ 1.47% PETR4 41.64 ▼ 0.05% VALE3 72.97 ▲ 0.83% ITUB4 38.60 ▼ 1.03% BBDC4 16.85 ▲ 0.36% ABEV3 14.89 ▼ 0.80% BBAS3 19.37 ▲ 0.47% B3SA3 14.26 ▼ 0.21% WEGE3 47.59 ▲ 0.49% PRIO3 59.14 ▼ 0.19% SUZB3 41.33 ▲ 2.35% RENT3 34.68 ▼ 0.09% AZZA3 15.89 ▼ 2.63% CSAN3 3.22 ▼ 1.83% RAIZ4 0.25 — 0.00% PCAR3 2.75 ▼ 0.36% GMAT3 3.65 ▼ 1.08% PSSA3 48.13 ▼ 0.54% CVCB3 1.33 ▼ 2.92% POSI3 3.36 ▲ 2.44% SLCE3 13.34 ▲ 0.30% NATU3 8.14 ▼ 0.73% IBOV 185,229.17 ▼ 0.41% IPSA 11,381.18 ▲ 1.30% IPC MEX 63,706.89 ▼ 0.26% MERVAL 3,021,926 ▼ 1.29% COLCAP 2,548.22 ▲ 1.05% BVL PERÚ 60,023.65 ▼ 1.13% USD/BRL 5.16 ▲ 0.01% USD/MXN 17.06 ▼ 0.24% USD/CLP 913.98 ▲ 0.04% USD/COP 3,140 ▲ 0.03% USD/PEN 3.36 ▼ 0.66% USD/ARS 1,493 ▲ 0.10% USD/UYU 40.27 ▲ 1.24% USD/PYG 5,939 ▲ 1.68% USD/BOB 11.64 ▼ 0.76% USD/DOP 58.34 ▲ 1.25% USD/CRC 445.92 ▲ 0.89% USD/GTQ 7.62 ▲ 2.21% USD/HNL 26.79 ▲ 1.57% USD/NIO 36.62 ▲ 0.69% USD/VES 762.44 ▼ 0.13% USD/PAB 1.00 — 0.00% USD/BZD 2.00 — 0.00% USD/JMD 157.28 — 0.00% USD/TTD 6.70 ▲ 0.61% EUR/BRL 5.95 ▲ 1.01% BRENT 88.88 ▼ 0.03% WTI 83.11 ▼ 0.11% IRON ORE 161.91 — — COPPER 6.61 ▲ 0.03% GOLD 4,461 ▲ 1.78% SILVER 65.59 ▲ 1.26% SOY 1,184 ▲ 3.20% CORN 480.50 ▲ 10.02% WHEAT 655.00 ▲ 3.93% COFFEE 317.25 ▼ 5.51% SUGAR 16.43 ▼ 1.79% ORANGE JUICE 138.55 ▼ 0.47% COTTON 85.03 ▲ 2.33% COCOA 5,719 ▲ 3.18% BEEF 223.60 ▼ 3.93% CATTLE 339.10 ▼ 3.16% LITHIUM 75.20 ▲ 1.47% PETR4 41.64 ▼ 0.05% VALE3 72.97 ▲ 0.83% ITUB4 38.60 ▼ 1.03% BBDC4 16.85 ▲ 0.36% ABEV3 14.89 ▼ 0.80% BBAS3 19.37 ▲ 0.47% B3SA3 14.26 ▼ 0.21% WEGE3 47.59 ▲ 0.49% PRIO3 59.14 ▼ 0.19% SUZB3 41.33 ▲ 2.35% RENT3 34.68 ▼ 0.09% AZZA3 15.89 ▼ 2.63% CSAN3 3.22 ▼ 1.83% RAIZ4 0.25 — 0.00% PCAR3 2.75 ▼ 0.36% GMAT3 3.65 ▼ 1.08% PSSA3 48.13 ▼ 0.54% CVCB3 1.33 ▼ 2.92% POSI3 3.36 ▲ 2.44% SLCE3 13.34 ▲ 0.30% NATU3 8.14 ▼ 0.73%
since 2009
Saturday, September 19, 2026

Brazil Business - Brazil

Brazil’s Industry Hits the Brakes in April: São Paulo’s Weakness Signals Broader Slowdown

By · June 11, 2025 · 2 min read

The LatAm Brief

One email, every weekday morning. What moved in Latin American markets, politics and expat life.

Yesterday’s subject line: “Brazil raised welfare 15% — seventeen days before the vote”

Free. We send a confirmation link first — nothing arrives until you click it. Unsubscribe with one click in any edition. If you stop opening us for 30 days we stop sending by ourselves, as we assume the interest is no longer there. See our privacy policy. We never share your email.

Brazil’s official statistics agency, IBGE, reported that national industrial production edged up just 0.1% in April 2025 compared to March. This marks a sharp slowdown from the 1.2% growth seen the previous month.

The modest increase fell short of market expectations and broke a ten-month streak of year-over-year gains. On an annual basis, output contracted by 0.3%, highlighting a loss of momentum across the sector.

São Paulo, the country’s industrial powerhouse, played a decisive role in this weak performance. The state’s factories saw output shrink by 1.7% in April, reversing a 2% gain in March.

This decline was the largest negative influence on the national result. Pharmaceuticals and chemical products suffered the steepest drop, falling by 8.5%.

Petroleum products and biofuels also declined by 3.8%. These sectors have faced rising costs and weaker demand, which have weighed on the state’s overall performance.
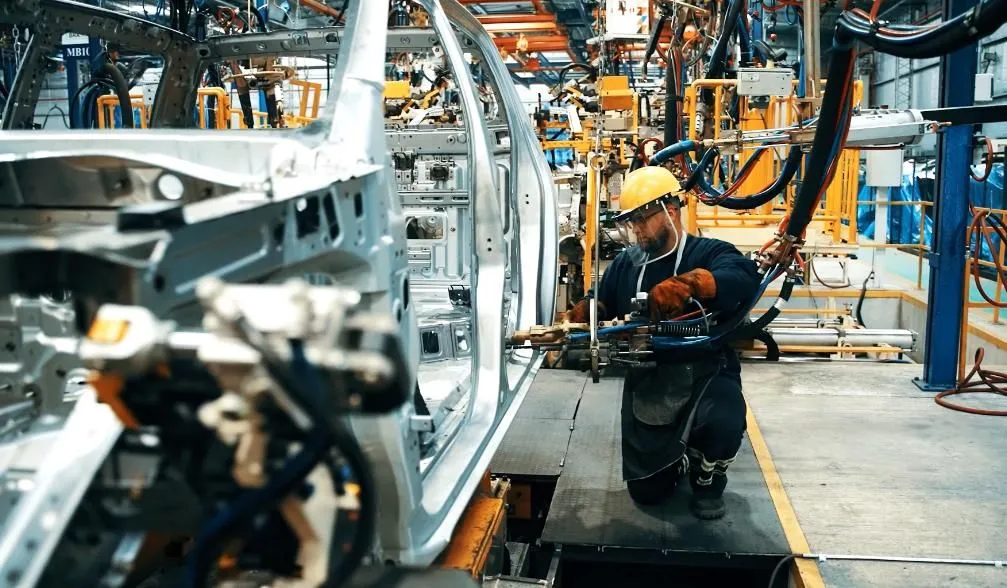
Brazil’s Industry Hits the Brakes in April: São Paulo’s Weakness Signals Broader Slowdown
Brazil’s Industry Hits the Brakes in April: São Paulo’s Weakness Signals Broader Slowdown.
One-stop reference
Company Intelligence
Every listed company in Latin America — financials, ownership and structure for 1,450+ companies across 26 exchanges, in one place.
Browse the directory →
RT
Ask Rio Times
Latin American markets, currencies and companies.
Open the full Ask Rio Times →

Out of 25 industrial sectors surveyed, only 13 recorded increased output. The extractive industries led gains with a 1% rise, while beverages grew by 3.6%.

However, these advances were not enough to offset losses in key sectors. The semi and non-durable goods segment dropped 5.4% compared to April 2024.

Despite a modest cumulative gain of 1.4% for the year, Brazil’s industrial output remains about 15% below its peak from May 2011. The sector is only slightly above pre-pandemic levels.

High interest rates, persistent inflation, and a weaker currency have driven up production costs and reduced business confidence. These factors have limited investment and slowed recovery in manufacturing.

Analysts warn that the sector’s outlook remains cautious. The best result for April since 2022 does not mask underlying challenges. Forecasts suggest industrial growth may slow to 1.6% for 2025, down from 3.1% last year.

The slowdown in São Paulo, which sets the pace for the country, signals that Brazil’s industry faces structural hurdles. This stagnation matters because industry drives jobs, investment, and tax revenue.

When factories cut output, the effects ripple through the economy. The April data shows Brazil’s industrial engine is losing steam, and the country must address its cost and competitiveness challenges to avoid deeper setbacks.

This article was produced by The Rio Times’ automated newsroom system. How we use AI · Report an error

LatAm Markets: Live Signals → — real-time movers, turnover leaders and FX across Latin America.

Read More from The Rio Times

The Rio Times · Power Map
See who really holds power in Latin America
Click to open the Power Map

Rotate for Best Experience

This report is optimized for landscape viewing. Rotate your phone for the full experience.