IBOV 187,206.89 ▼ 0.56% IPSA 11,220.60 ▼ 0.16% IPC MEX 63,924.77 ▼ 0.28% MERVAL 3,098,898 ▼ 1.87% COLCAP 2,589.69 ▼ 1.41% BVL PERÚ 59,373.28 ▼ 0.32% USD/BRL5.13▲ 0.40% USD/MXN16.96▼ 0.14% USD/CLP941.13— 0.00% USD/COP3,078— 0.00% USD/PEN3.35▲ 0.03% USD/ARS1,509▼ 0.28% USD/UYU40.26▲ 3.12% USD/PYG5,903▲ 3.23% USD/BOB11.98▼ 2.70% USD/DOP58.96▲ 0.79% USD/CRC447.55▲ 1.57% USD/GTQ7.63▲ 2.98% USD/HNL26.85▲ 0.57% USD/NIO36.62— 0.00% USD/VES830.41▼ 0.13% USD/PAB1.00— 0.00% USD/BZD2.00— 0.00% USD/JMD 157.28 — 0.00% USD/TTD6.74▲ 2.35% EUR/BRL5.95▲ 0.25% BRENT 88.88 ▼ 0.03% WTI 83.11 ▼ 0.11% IRON ORE 161.91 — — COPPER 6.61 ▲ 0.03% GOLD 4,461 ▲ 1.78% SILVER 65.59 ▲ 1.26% SOY 1,184 ▲ 3.20% CORN 480.50 ▲ 10.02% WHEAT 655.00 ▲ 3.93% COFFEE 317.25 ▼ 5.51% SUGAR 16.43 ▼ 1.79% ORANGE JUICE 138.55 ▼ 0.47% COTTON 85.03 ▲ 2.33% COCOA 5,719 ▲ 3.18% BEEF 223.60 ▼ 3.93% CATTLE 339.10 ▼ 3.16% LITHIUM 75.20 ▲ 1.47% PETR4 41.64 ▼ 0.05% VALE3 72.97 ▲ 0.83% ITUB4 38.60 ▼ 1.03% BBDC4 16.85 ▲ 0.36% ABEV3 14.89 ▼ 0.80% BBAS3 19.37 ▲ 0.47% B3SA3 14.26 ▼ 0.21% WEGE3 47.59 ▲ 0.49% PRIO3 59.14 ▼ 0.19% SUZB3 41.33 ▲ 2.35% RENT3 34.68 ▼ 0.09% AZZA3 15.89 ▼ 2.63% CSAN3 3.22 ▼ 1.83% RAIZ4 0.25 — 0.00% PCAR3 2.75 ▼ 0.36% GMAT3 3.65 ▼ 1.08% PSSA3 48.13 ▼ 0.54% CVCB3 1.33 ▼ 2.92% POSI3 3.36 ▲ 2.44% SLCE3 13.34 ▲ 0.30% NATU3 8.14 ▼ 0.73% IBOV 187,206.89 ▼ 0.56% IPSA 11,220.60 ▼ 0.16% IPC MEX 63,924.77 ▼ 0.28% MERVAL 3,098,898 ▼ 1.87% COLCAP 2,589.69 ▼ 1.41% BVL PERÚ 59,373.28 ▼ 0.32% USD/BRL 5.16 ▲ 0.01% USD/MXN 17.06 ▼ 0.24% USD/CLP 913.98 ▲ 0.04% USD/COP 3,140 ▲ 0.03% USD/PEN 3.36 ▼ 0.66% USD/ARS 1,493 ▲ 0.10% USD/UYU 40.27 ▲ 1.24% USD/PYG 5,939 ▲ 1.68% USD/BOB 11.64 ▼ 0.76% USD/DOP 58.34 ▲ 1.25% USD/CRC 445.92 ▲ 0.89% USD/GTQ 7.62 ▲ 2.21% USD/HNL 26.79 ▲ 1.57% USD/NIO 36.62 ▲ 0.69% USD/VES 762.44 ▼ 0.13% USD/PAB 1.00 — 0.00% USD/BZD 2.00 — 0.00% USD/JMD 157.28 — 0.00% USD/TTD 6.70 ▲ 0.61% EUR/BRL 5.95 ▲ 1.01% BRENT 88.88 ▼ 0.03% WTI 83.11 ▼ 0.11% IRON ORE 161.91 — — COPPER 6.61 ▲ 0.03% GOLD 4,461 ▲ 1.78% SILVER 65.59 ▲ 1.26% SOY 1,184 ▲ 3.20% CORN 480.50 ▲ 10.02% WHEAT 655.00 ▲ 3.93% COFFEE 317.25 ▼ 5.51% SUGAR 16.43 ▼ 1.79% ORANGE JUICE 138.55 ▼ 0.47% COTTON 85.03 ▲ 2.33% COCOA 5,719 ▲ 3.18% BEEF 223.60 ▼ 3.93% CATTLE 339.10 ▼ 3.16% LITHIUM 75.20 ▲ 1.47% PETR4 41.64 ▼ 0.05% VALE3 72.97 ▲ 0.83% ITUB4 38.60 ▼ 1.03% BBDC4 16.85 ▲ 0.36% ABEV3 14.89 ▼ 0.80% BBAS3 19.37 ▲ 0.47% B3SA3 14.26 ▼ 0.21% WEGE3 47.59 ▲ 0.49% PRIO3 59.14 ▼ 0.19% SUZB3 41.33 ▲ 2.35% RENT3 34.68 ▼ 0.09% AZZA3 15.89 ▼ 2.63% CSAN3 3.22 ▼ 1.83% RAIZ4 0.25 — 0.00% PCAR3 2.75 ▼ 0.36% GMAT3 3.65 ▼ 1.08% PSSA3 48.13 ▼ 0.54% CVCB3 1.33 ▼ 2.92% POSI3 3.36 ▲ 2.44% SLCE3 13.34 ▲ 0.30% NATU3 8.14 ▼ 0.73%
since 2009
Sunday, September 13, 2026

Brazil Business - Brazil

Brazilian Export Landscape Shifts: Half the Shipments Lost to U.S. Since 2001

By · July 15, 2025 · 2 min read

The LatAm Brief

One email, every weekday morning. What moved in Latin American markets, politics and expat life.

Yesterday’s subject line: “'The false peace is over' - Colombia”

Free. We send a confirmation link first — nothing arrives until you click it. Unsubscribe with one click in any edition. If you stop opening us for 30 days we stop sending by ourselves, as we assume the interest is no longer there. See our privacy policy. We never share your email.

Official government export data show a steady drop in the share of Brazilian exports to the United States since 2001. Back then, nearly one in every four dollars Brazil earned from exports came from the US market.

By 2024, that share slumped to about 12%. This decline, reported by the Getulio Vargas Foundation and Brazilian trade authorities, underlines a major shift in global trade patterns.

While the US faded in its role as a main buyer, China surged ahead. In 2001, China received only about 3% of Brazil’s exports. By 2024, it commanded a 28% share, making it the country’s dominant trading partner.

It was also the leading buyer of commodities like soybeans, oil, and iron ore. The European Union and South America also saw their proportions drop, though both remain ahead of the US in Brazil’s export rankings.

Trade figures reveal that the US still purchases a variety of Brazilian products, from crude oil and iron products to aircraft, fruit juices, and coffee. The ten largest categories of exports to the US account for over half the value of all shipments.
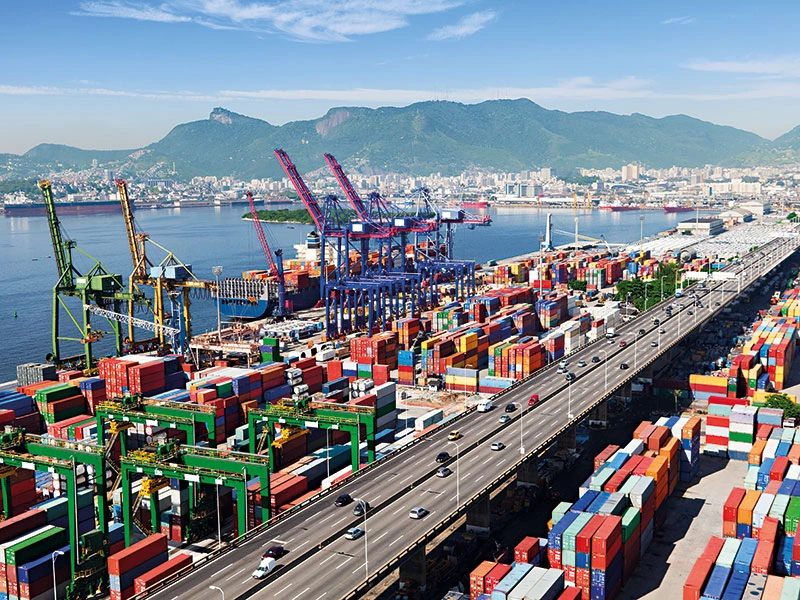
Brazilian Export Landscape Shifts: Half the Shipments Lost to U.S. Since 2001
Brazilian Export Landscape Shifts: Half the Shipments Lost to U.S. Since 2001.
One-stop reference
Company Intelligence
Every listed company in Latin America — financials, ownership and structure for 1,450+ companies across 26 exchanges, in one place.
Browse the directory →

Yet, for many Brazilian industries, the rapid expansion of China’s appetite for raw materials means less reliance on the United States. This realignment in export destinations has tracked broader changes.

Imports from China into Brazil also soared over the same period, while those from the US fell in both absolute and relative terms. China now plays the largest role in Brazilian imports as well.

As a result, China’s economic influence has become central to Brazil’s trade outlook. Policy moves from the US added new pressures. In 2025, the US government announced a sharp 50% tariff on many Brazilian goods.

Analysts expect this measure to cut into Brazilian GDP and squeeze exporters of processed foods, cast iron, machinery, and more. The Brazilian government has signaled the use of economic reciprocity laws, which could lead to matching tariffs on American imports.

Brazil’s trade balance stayed positive in recent years, but the nature of exports shifted. Industry monitoring bodies highlight that Brazil has grown more dependent on commodity sales and less on manufacturing.

Data show a steady fall in industry’s share of economic output and jobs, as commodities account for most new export growth. For businesses and policymakers, the halving of exports to the US marks a reshaping of commercial strategies.

Boardrooms and ministries across Brazil and beyond track these figures, recognizing that shifting trade alliances determine the fate of entire industrial sectors, price stability, and employment prospects in the world’s economies.

Share of Brazilian Exports

China: 28%
European Union: 14.3%
South America: 12.2%
United States: 12%

Live Market IntelligenceBrazil — Live Market BoardInside: market breadth, the sector heatmap, currencies & rates, the Latin America scoreboard and the full instrument board.

Rio Times · Live Market Intelligence

Brazil — Live Market Board

B3 · São Paulo
Sep 13, 2026 · 12:28

Ibovespa · benchmark
187,206.89
-0.56%
L 167,142day rangeH 168,310

+21.85% over 12 months

Market breadth · 15 names
47% advancing

7 ▲ advancing8 declining ▼

Currencies, rates & key inputs
USD / BRL
5.16
+0.01%

EUR / BRL
5.95
+1.01%

Selic rate
14.00%
·

Brent crude
88.88
-0.03%

Iron ore
161.91
·

Sector heatmap · average move today
Materials
+2.35%
SUZB3

Mining
+1.16%
VALE3, CSNA3, GGBR4

Industrials
+0.20%
WEGE3, RENT3

Financials
-0.10%
ITUB4, BBDC4, BBAS3, B3SA3

Energy
-0.12%
PETR4, PRIO3

Consumer Staples
-0.80%
ABEV3

Utilities
-1.38%
ENEV3

Consumer Disc.
-2.63%
AZZA3

Latin America scoreboard
IndexLastTodayStrength
IbovespaBrazil
187,206.89
-0.56%

S&P/BMV IPCMexico
63,924.77
-0.28%

S&P IPSAChile
11,220.60
-0.16%

S&P MERVALArgentina
3,098,898
-1.87%

MSCI COLCAPColombia
2,589.69
-1.41%

BVL S&P PerúPeru
59,373.28
-0.32%

Full instrument board
Instrument Last Change YoY Prev. High Low Volume
IBOV 187,206.89 -0.56% +21.85% 188,268.59 168,310 167,142
USD/BRL 5.16 +0.01% -5.13% 5.16 5.18 5.14
SELIC 14.00%
PETR4 41.64 -0.05% +35.19% 41.66 41.97 41.15 41,499,400
VALE3 72.97 +0.83% +30.75% 72.37 73.54 72.66 17,658,000
ITUB4 38.60 -1.03% +4.57% 39.00 39.34 38.39 29,487,800
BBDC4 16.85 +0.36% +3.50% 16.79 16.90 16.67 19,416,900
BBAS3 19.37 +0.47% +0.73% 19.28 19.44 19.16 11,069,200
B3SA3 14.26 -0.21% +12.73% 14.29 14.47 14.11 33,037,800
ABEV3 14.89 -0.80% +21.91% 15.01 15.07 14.81 16,453,100
WEGE3 47.59 +0.49% +29.99% 47.36 48.08 47.36 3,364,600
PRIO3 59.14 -0.19% +50.67% 59.25 59.81 58.74 3,325,600
SUZB3 41.33 +2.35% -23.55% 40.38 41.48 40.35 3,914,900
RENT3 34.68 -0.09% +0.84% 34.71 34.96 34.35 7,979,100
AZZA3 15.89 -2.63% -53.76% 16.32 16.42 15.82 1,330,300
CSNA3 4.30 +0.47% -42.65% 4.28 4.41 4.26 10,076,100
GGBR4 24.69 +2.19% +51.38% 24.16 24.85 24.18 7,047,600
ENEV3 24.21 -1.38% +70.49% 24.55 24.64 23.99 9,297,000

Largest moves today
AZZA3
15.89
-2.63%
SUZB3
41.33
+2.35%
GGBR4
24.69
+2.19%
ENEV3
24.21
-1.38%
ITUB4
38.60
-1.03%
VALE3
72.97
+0.83%
ABEV3
14.89
-0.80%
IBOV
187,206.89
-0.56%

The session read
The Ibovespa eased 0.56%, with breadth negative — 7 of 15 names higher. Materials led, while Consumer Disc. lagged.

This article was produced by The Rio Times’ automated newsroom system. How we use AI · Report an error

Read More from The Rio Times

The Rio Times · Power Map
See who really holds power in Latin America
Click to open the Power Map

Rotate for Best Experience

This report is optimized for landscape viewing. Rotate your phone for the full experience.