IBOV 185,547.66 ▼ 0.51% IPSA 11,235.54 ▼ 0.77% IPC MEX 63,507.11 ▼ 1.11% MERVAL 3,028,871 ▼ 1.65% COLCAP 2,511.76 ▼ 2.16% BVL PERÚ 58,496.57 ▲ 0.80% USD/BRL5.15▼ 0.13% USD/MXN17.21▼ 0.19% USD/CLP954.20▼ 0.22% USD/COP3,124▲ 0.06% USD/PEN3.37▲ 0.45% USD/ARS1,512▲ 0.37% USD/UYU40.19▲ 2.94% USD/PYG5,905▲ 1.29% USD/BOB10.10▼ 13.67% USD/DOP59.01▲ 0.27% USD/CRC444.45▲ 1.84% USD/GTQ7.62▲ 2.98% USD/HNL26.85▲ 0.27% USD/NIO36.62▲ 2.69% USD/VES845.33▼ 0.02% USD/PAB1.00— 0.00% USD/BZD2.00— 0.00% USD/JMD 157.28 — 0.00% USD/TTD6.73▲ 2.25% EUR/BRL5.90▼ 0.40% BRENT 88.88 ▼ 0.03% WTI 83.11 ▼ 0.11% IRON ORE 161.91 — — COPPER 6.61 ▲ 0.03% GOLD 4,461 ▲ 1.78% SILVER 65.59 ▲ 1.26% SOY 1,184 ▲ 3.20% CORN 480.50 ▲ 10.02% WHEAT 655.00 ▲ 3.93% COFFEE 317.25 ▼ 5.51% SUGAR 16.43 ▼ 1.79% ORANGE JUICE 138.55 ▼ 0.47% COTTON 85.03 ▲ 2.33% COCOA 5,719 ▲ 3.18% BEEF 223.60 ▼ 3.93% CATTLE 339.10 ▼ 3.16% LITHIUM 75.20 ▲ 1.47% PETR4 41.64 ▼ 0.05% VALE3 72.97 ▲ 0.83% ITUB4 38.60 ▼ 1.03% BBDC4 16.85 ▲ 0.36% ABEV3 14.89 ▼ 0.80% BBAS3 19.37 ▲ 0.47% B3SA3 14.26 ▼ 0.21% WEGE3 47.59 ▲ 0.49% PRIO3 59.14 ▼ 0.19% SUZB3 41.33 ▲ 2.35% RENT3 34.68 ▼ 0.09% AZZA3 15.89 ▼ 2.63% CSAN3 3.22 ▼ 1.83% RAIZ4 0.25 — 0.00% PCAR3 2.75 ▼ 0.36% GMAT3 3.65 ▼ 1.08% PSSA3 48.13 ▼ 0.54% CVCB3 1.33 ▼ 2.92% POSI3 3.36 ▲ 2.44% SLCE3 13.34 ▲ 0.30% NATU3 8.14 ▼ 0.73% IBOV 185,547.66 ▼ 0.51% IPSA 11,235.54 ▼ 0.77% IPC MEX 63,507.11 ▼ 1.11% MERVAL 3,028,871 ▼ 1.65% COLCAP 2,511.76 ▼ 2.16% BVL PERÚ 58,496.57 ▲ 0.80% USD/BRL 5.16 ▲ 0.01% USD/MXN 17.06 ▼ 0.24% USD/CLP 913.98 ▲ 0.04% USD/COP 3,140 ▲ 0.03% USD/PEN 3.36 ▼ 0.66% USD/ARS 1,493 ▲ 0.10% USD/UYU 40.27 ▲ 1.24% USD/PYG 5,939 ▲ 1.68% USD/BOB 11.64 ▼ 0.76% USD/DOP 58.34 ▲ 1.25% USD/CRC 445.92 ▲ 0.89% USD/GTQ 7.62 ▲ 2.21% USD/HNL 26.79 ▲ 1.57% USD/NIO 36.62 ▲ 0.69% USD/VES 762.44 ▼ 0.13% USD/PAB 1.00 — 0.00% USD/BZD 2.00 — 0.00% USD/JMD 157.28 — 0.00% USD/TTD 6.70 ▲ 0.61% EUR/BRL 5.95 ▲ 1.01% BRENT 88.88 ▼ 0.03% WTI 83.11 ▼ 0.11% IRON ORE 161.91 — — COPPER 6.61 ▲ 0.03% GOLD 4,461 ▲ 1.78% SILVER 65.59 ▲ 1.26% SOY 1,184 ▲ 3.20% CORN 480.50 ▲ 10.02% WHEAT 655.00 ▲ 3.93% COFFEE 317.25 ▼ 5.51% SUGAR 16.43 ▼ 1.79% ORANGE JUICE 138.55 ▼ 0.47% COTTON 85.03 ▲ 2.33% COCOA 5,719 ▲ 3.18% BEEF 223.60 ▼ 3.93% CATTLE 339.10 ▼ 3.16% LITHIUM 75.20 ▲ 1.47% PETR4 41.64 ▼ 0.05% VALE3 72.97 ▲ 0.83% ITUB4 38.60 ▼ 1.03% BBDC4 16.85 ▲ 0.36% ABEV3 14.89 ▼ 0.80% BBAS3 19.37 ▲ 0.47% B3SA3 14.26 ▼ 0.21% WEGE3 47.59 ▲ 0.49% PRIO3 59.14 ▼ 0.19% SUZB3 41.33 ▲ 2.35% RENT3 34.68 ▼ 0.09% AZZA3 15.89 ▼ 2.63% CSAN3 3.22 ▼ 1.83% RAIZ4 0.25 — 0.00% PCAR3 2.75 ▼ 0.36% GMAT3 3.65 ▼ 1.08% PSSA3 48.13 ▼ 0.54% CVCB3 1.33 ▼ 2.92% POSI3 3.36 ▲ 2.44% SLCE3 13.34 ▲ 0.30% NATU3 8.14 ▼ 0.73%
since 2009
Thursday, September 17, 2026

Mexico Southeast Asia

Vietnam Emerges as Frontrunner in Global Nearshoring Trend, Outpacing Mexico

By · November 17, 2024 · 2 min read

The LatAm Brief

One email, every weekday morning. What moved in Latin American markets, politics and expat life.

Yesterday’s subject line: “Maduro's money man just pleaded guilty”

Free. We send a confirmation link first — nothing arrives until you click it. Unsubscribe with one click in any edition. If you stop opening us for 30 days we stop sending by ourselves, as we assume the interest is no longer there. See our privacy policy. We never share your email.

The landscape of global manufacturing is changing rapidly. Recent data from S&P Global Market Intelligence reveals a significant trend. Vietnam has emerged as a leading destination for companies relocating their production facilities. This shift aims to protect supply chains from potential disruptions.

The numbers tell a compelling story. Over 35% of Vietnamese firms reported increased demand from multinational manufacturers in the past year. This contrasts sharply with Mexico, where only 15% of companies experienced similar growth. The survey, conducted in May 2024, highlights Vietnam’s growing appeal to international businesses.

Several factors contribute to Vietnam’s success in this arena. The country’s geographical location provides easy access to major Asian markets. Labor costs remain competitive, attracting companies looking to optimize their expenses. The Vietnamese government has also implemented policies that support foreign investment.
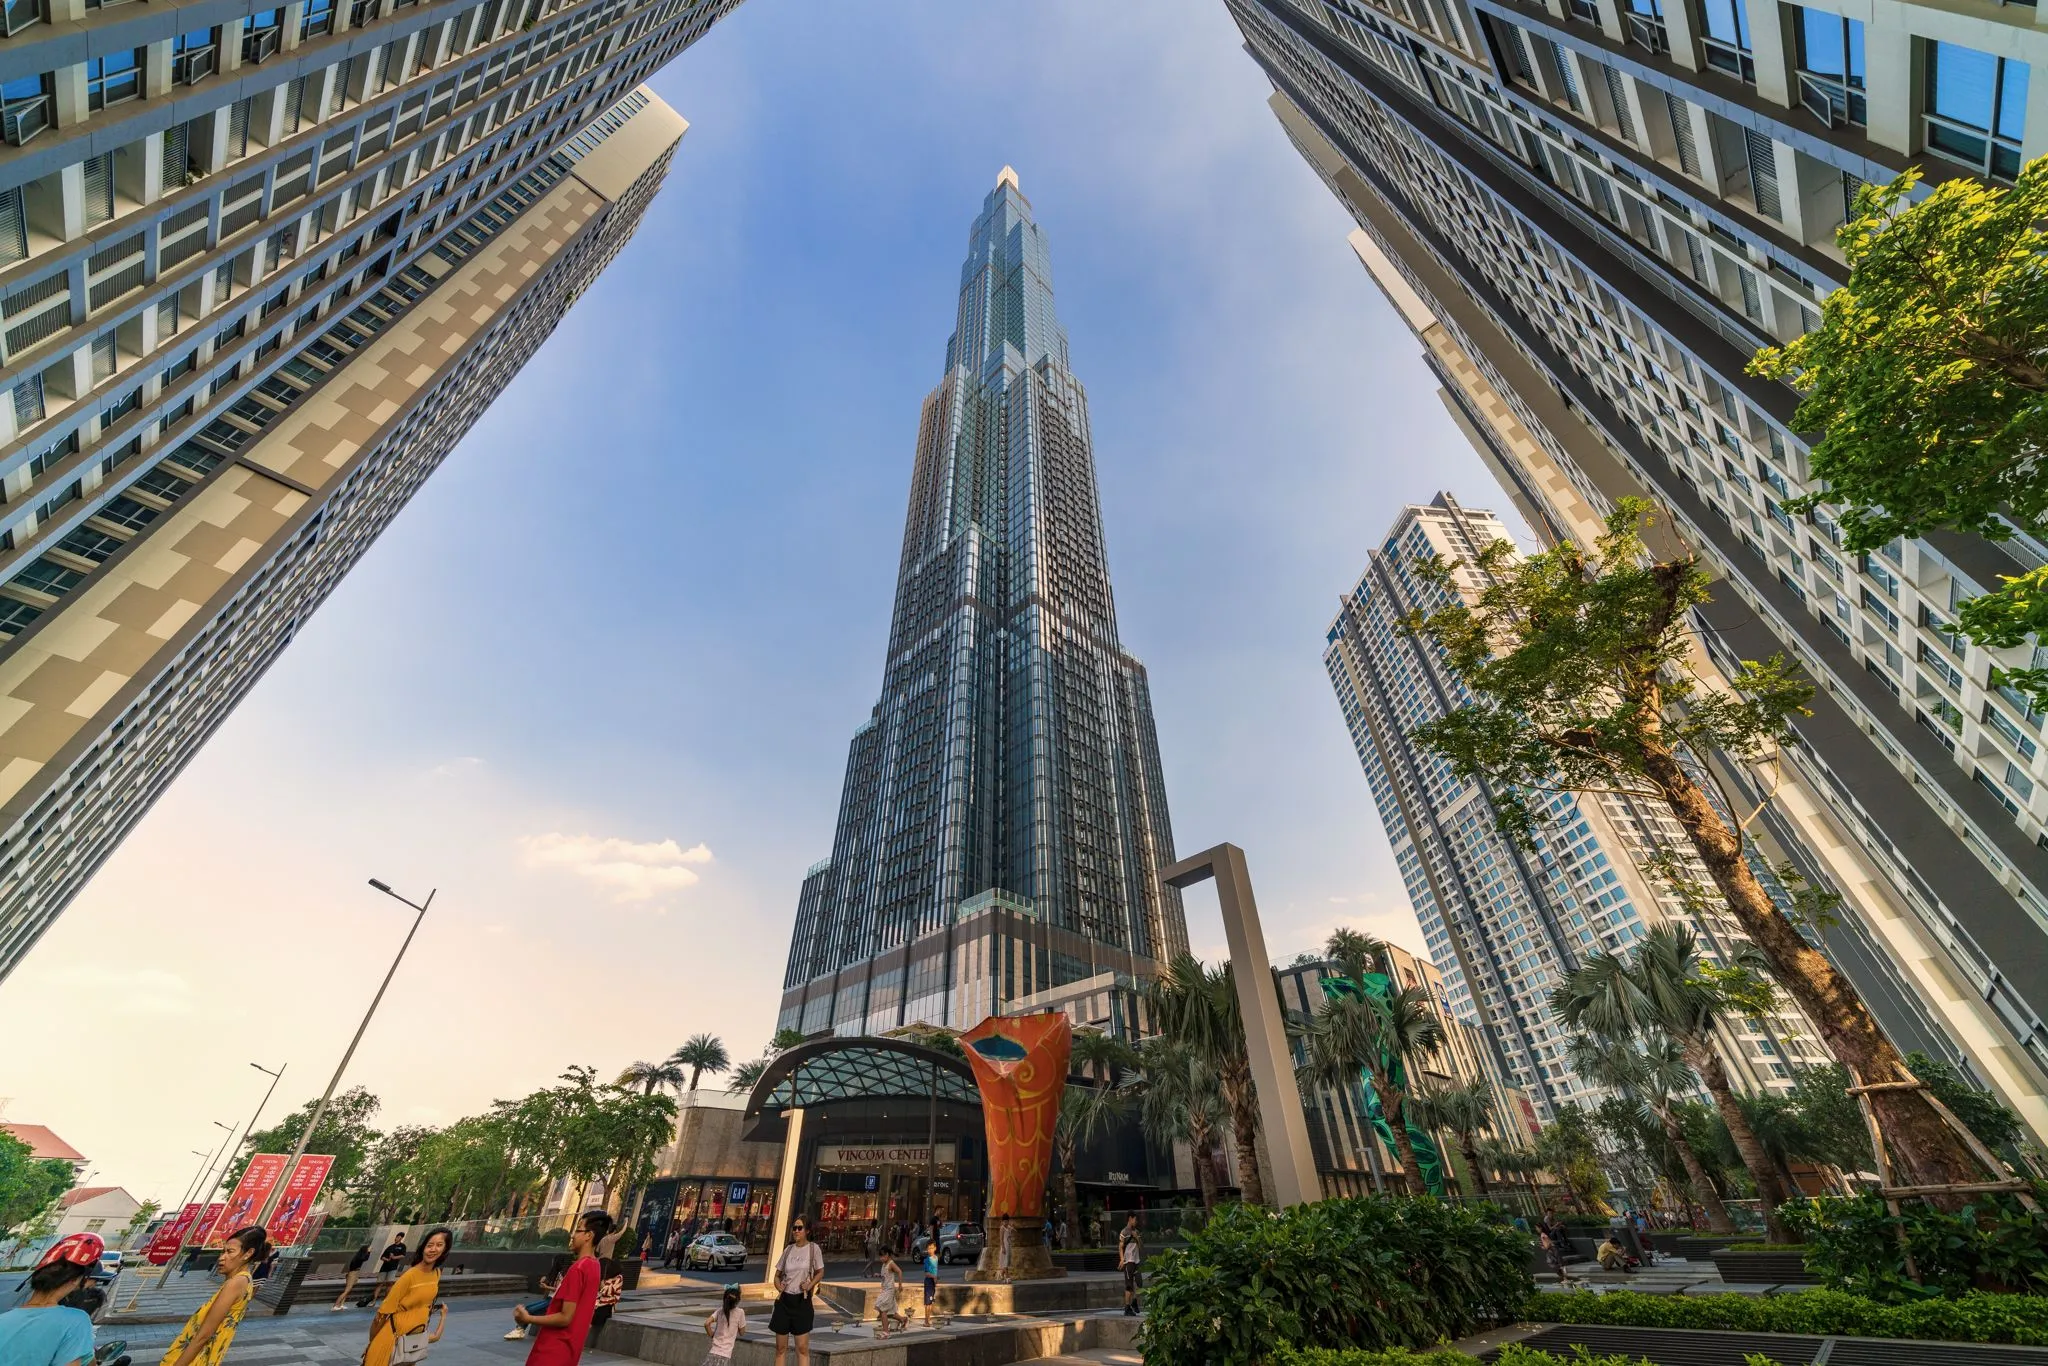
Vietnam Emerges as Frontrunner in Global Nearshoring Trend, Outpacing Mexico - Saigon.
Vietnam Emerges as Frontrunner in Global Nearshoring Trend, Outpacing Mexico – Saigon.
One-stop reference
Company Intelligence
Every listed company in Latin America — financials, ownership and structure for 1,450+ companies across 26 exchanges, in one place.
Browse the directory →
RT
Ask Rio Times
17 years of Latin America reporting, on demand.
Open the full Ask Rio Times →

Vietnam’s workforce plays a crucial role in this success story. The country ranks 9th among 60 nations in ManpowerGroup’s Total Workforce Index. This indicates a reliable and skilled labor pool. Such a workforce is essential for companies considering relocation.

Vietnam Emerges as Frontrunner in Global Nearshoring Trend, Outpacing Mexico

Real-world examples underscore Vietnam’s attractiveness. Samsung has invested heavily in Vietnamese factories for electronics production. Nike and Adidas have shifted substantial production from China to Vietnam. Intel has also established a significant presence with a chip plant in Saigon (Ho Chi Minh City).

Mexico, while benefiting from nearshoring, has seen slower progress. Companies in certain Mexican states report increased sales related to nearshoring. However, the overall impact has been less pronounced than in Vietnam. Mexican manufacturers remain optimistic about future growth opportunities.

Mexico’s Nearshoring Boost: A Modest 0.2% GDP Growth Amidst Regional Challenges

The window for countries to capitalize on this trend is limited. Experts estimate a 10-12 year period for investment relocation. This timeframe adds urgency to the competition between emerging manufacturing hubs. Countries must act swiftly to attract and retain these investments.

The competition between Vietnam, Mexico, and other nations will likely intensify. Each country must adapt its strategies to remain attractive to international businesses. This may involve investments in infrastructure and creating favorable business environments.


Key Facts

Deep Dive

For the complete picture, read our in-depth guide: Mexico Economy 2026: GDP, Peso, Nearshoring, Banxico and Trade

This article was produced by The Rio Times’ automated newsroom system. How we use AI · Report an error

Read More from The Rio Times

The Rio Times · Power Map
See who really holds power in Latin America
Click to open the Power Map

Rotate for Best Experience

This report is optimized for landscape viewing. Rotate your phone for the full experience.