IBOV 185,146.69 ▼ 0.26% IPSA 11,289.90 ▼ 0.71% IPC MEX 64,814.97 ▼ 0.39% MERVAL 3,107,396 ▼ 0.09% COLCAP 2,580.41 ▼ 0.14% BVL PERÚ 60,702.89 ▼ 1.24% USD/BRL5.10▼ 0.17% USD/MXN16.97▲ 0.44% USD/CLP938.50▲ 1.17% USD/COP3,087▼ 0.96% USD/PEN3.37▲ 0.35% USD/ARS1,512▼ 0.12% USD/UYU40.24▲ 3.05% USD/PYG5,868▲ 2.26% USD/BOB12.36▲ 1.91% USD/DOP58.63▲ 0.22% USD/CRC447.58▲ 1.69% USD/GTQ7.63▲ 3.04% USD/HNL26.85▲ 0.57% USD/NIO36.62▲ 0.34% USD/VES825.67▼ 0.13% USD/PAB1.00— 0.00% USD/BZD2.00— 0.00% USD/JMD 157.28 — 0.00% USD/TTD6.73▲ 2.40% EUR/BRL5.93▲ 0.36% BRENT 88.88 ▼ 0.03% WTI 83.11 ▼ 0.11% IRON ORE 161.91 — — COPPER 6.61 ▲ 0.03% GOLD 4,461 ▲ 1.78% SILVER 65.59 ▲ 1.26% SOY 1,184 ▲ 3.20% CORN 480.50 ▲ 10.02% WHEAT 655.00 ▲ 3.93% COFFEE 317.25 ▼ 5.51% SUGAR 16.43 ▼ 1.79% ORANGE JUICE 138.55 ▼ 0.47% COTTON 85.03 ▲ 2.33% COCOA 5,719 ▲ 3.18% BEEF 223.60 ▼ 3.93% CATTLE 339.10 ▼ 3.16% LITHIUM 75.20 ▲ 1.47% PETR4 41.64 ▼ 0.05% VALE3 72.97 ▲ 0.83% ITUB4 38.60 ▼ 1.03% BBDC4 16.85 ▲ 0.36% ABEV3 14.89 ▼ 0.80% BBAS3 19.37 ▲ 0.47% B3SA3 14.26 ▼ 0.21% WEGE3 47.59 ▲ 0.49% PRIO3 59.14 ▼ 0.19% SUZB3 41.33 ▲ 2.35% RENT3 34.68 ▼ 0.09% AZZA3 15.89 ▼ 2.63% CSAN3 3.22 ▼ 1.83% RAIZ4 0.25 — 0.00% PCAR3 2.75 ▼ 0.36% GMAT3 3.65 ▼ 1.08% PSSA3 48.13 ▼ 0.54% CVCB3 1.33 ▼ 2.92% POSI3 3.36 ▲ 2.44% SLCE3 13.34 ▲ 0.30% NATU3 8.14 ▼ 0.73% IBOV 185,146.69 ▼ 0.26% IPSA 11,289.90 ▼ 0.71% IPC MEX 64,814.97 ▼ 0.39% MERVAL 3,107,396 ▼ 0.09% COLCAP 2,580.41 ▼ 0.14% BVL PERÚ 60,702.89 ▼ 1.24% USD/BRL 5.16 ▲ 0.01% USD/MXN 17.06 ▼ 0.24% USD/CLP 913.98 ▲ 0.04% USD/COP 3,140 ▲ 0.03% USD/PEN 3.36 ▼ 0.66% USD/ARS 1,493 ▲ 0.10% USD/UYU 40.27 ▲ 1.24% USD/PYG 5,939 ▲ 1.68% USD/BOB 11.64 ▼ 0.76% USD/DOP 58.34 ▲ 1.25% USD/CRC 445.92 ▲ 0.89% USD/GTQ 7.62 ▲ 2.21% USD/HNL 26.79 ▲ 1.57% USD/NIO 36.62 ▲ 0.69% USD/VES 762.44 ▼ 0.13% USD/PAB 1.00 — 0.00% USD/BZD 2.00 — 0.00% USD/JMD 157.28 — 0.00% USD/TTD 6.70 ▲ 0.61% EUR/BRL 5.95 ▲ 1.01% BRENT 88.88 ▼ 0.03% WTI 83.11 ▼ 0.11% IRON ORE 161.91 — — COPPER 6.61 ▲ 0.03% GOLD 4,461 ▲ 1.78% SILVER 65.59 ▲ 1.26% SOY 1,184 ▲ 3.20% CORN 480.50 ▲ 10.02% WHEAT 655.00 ▲ 3.93% COFFEE 317.25 ▼ 5.51% SUGAR 16.43 ▼ 1.79% ORANGE JUICE 138.55 ▼ 0.47% COTTON 85.03 ▲ 2.33% COCOA 5,719 ▲ 3.18% BEEF 223.60 ▼ 3.93% CATTLE 339.10 ▼ 3.16% LITHIUM 75.20 ▲ 1.47% PETR4 41.64 ▼ 0.05% VALE3 72.97 ▲ 0.83% ITUB4 38.60 ▼ 1.03% BBDC4 16.85 ▲ 0.36% ABEV3 14.89 ▼ 0.80% BBAS3 19.37 ▲ 0.47% B3SA3 14.26 ▼ 0.21% WEGE3 47.59 ▲ 0.49% PRIO3 59.14 ▼ 0.19% SUZB3 41.33 ▲ 2.35% RENT3 34.68 ▼ 0.09% AZZA3 15.89 ▼ 2.63% CSAN3 3.22 ▼ 1.83% RAIZ4 0.25 — 0.00% PCAR3 2.75 ▼ 0.36% GMAT3 3.65 ▼ 1.08% PSSA3 48.13 ▼ 0.54% CVCB3 1.33 ▼ 2.92% POSI3 3.36 ▲ 2.44% SLCE3 13.34 ▲ 0.30% NATU3 8.14 ▼ 0.73%
since 2009
Thursday, September 10, 2026

Agri Business Business - Brazil

Russia’s Grain Output Drops: 130 Million Tonnes Forecast for 2024

By · November 13, 2024 · 2 min read

The LatAm Brief

One email, every weekday morning. What moved in Latin American markets, politics and expat life.

Yesterday’s subject line: “YPF sells US$1.2bn bond, Argentina's biggest since 2015”

Free. We send a confirmation link first — nothing arrives until you click it. Unsubscribe with one click in any edition. If you stop opening us for 30 days we stop sending by ourselves, as we assume the interest is no longer there. See our privacy policy. We never share your email.

Russia’s grain production outlook for 2024 has taken an unexpected turn. The country’s Agriculture Ministry recently announced a forecast of 130 million tonnes of grain for the upcoming year.

This figure represents a significant decrease from previous years’ harvests. The 2024 projection marks a 12% decline from the 148 million tonnes produced in 2023.

It also falls 18% short of the record 158 million tonnes harvested in 2022. These numbers reflect a concerning trend for the world’s largest wheat exporter.

Weather conditions have played a crucial role in this downturn. Drought and frost have affected key grain-producing regions across Russia. The impact of these adverse conditions extends beyond immediate production concerns.

Russian farmers now face challenges in wheat sales, leading to reduced market liquidity. This situation raises worries about winter planting for the 2025-2026 crop. Long-term supply issues loom on the horizon as a result.
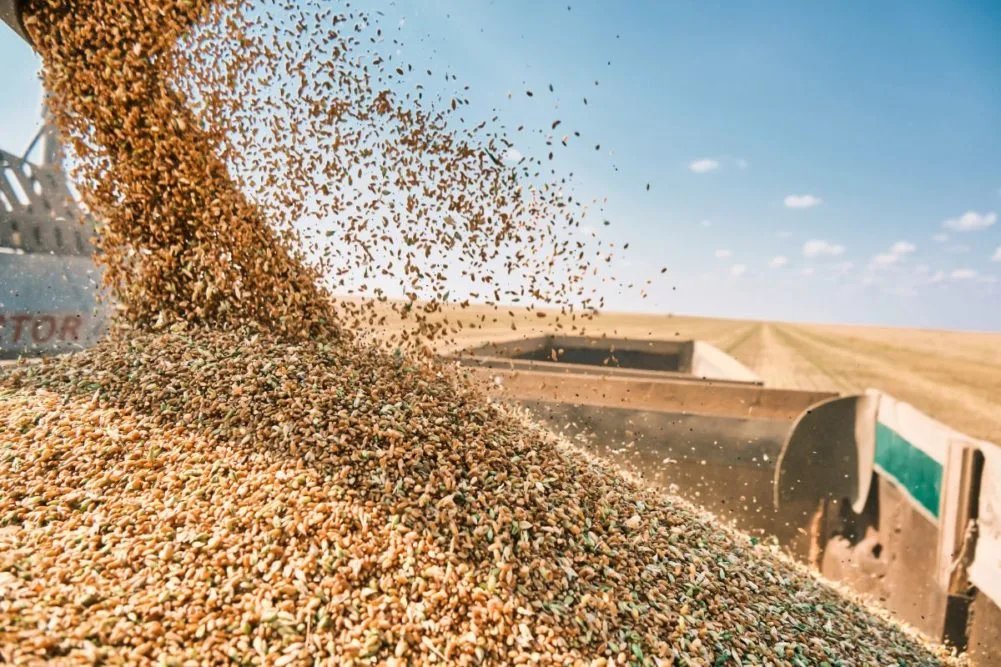
Russia's Grain Output Drops: 130 Million Tonnes Forecast for 2024
Russia’s Grain Output Drops: 130 Million Tonnes Forecast for 2024.
One-stop reference
Company Intelligence
Every listed company in Latin America — financials, ownership and structure for 1,450+ companies across 26 exchanges, in one place.
Browse the directory →
RT
Ask Rio Times
Latin American markets, currencies and companies.
Open the full Ask Rio Times →

The Russian government’s estimates include data from Ukrainian territories under Russian control. This inclusion has sparked controversy within the agricultural sector. Some industry experts question the accuracy of these figures.

Global Market Impact

Global markets have reacted strongly to Russia’s production forecast. Wheat prices have surged, reaching levels not seen since mid-2024. This price volatility affects importers worldwide, particularly in the Middle East and North Africa.

Egypt, a top buyer of Russian wheat, has already purchased 1.4 million metric tons in September alone. This high demand underscores the continued reliance on Russian exports despite ongoing challenges.

Other major wheat-producing countries feel the ripple effects of Russia’s situation. Romania and Bulgaria have seen their wheat prices rise by 6.7% over two weeks. However, they struggle to compete effectively with Russian wheat in global markets.

The quality of Russian grain in 2024 reportedly surpasses that of the previous year. This improvement comes despite unfavorable weather conditions during cultivation and harvesting.

A third of the wheat crop falls into the top three quality grades. As of early October, Russia had harvested cereal and leguminous crops from 91% of the sown area.

The total yield exceeded 120 million tonnes. These figures suggest a resilient agricultural sector despite numerous challenges.

This article was produced by The Rio Times’ automated newsroom system. How we use AI · Report an error

Read More from The Rio Times

The Rio Times · Power Map
See who really holds power in Latin America
Click to open the Power Map

Rotate for Best Experience

This report is optimized for landscape viewing. Rotate your phone for the full experience.