PERU · TRADE
Key Facts
- The total US$63.521 billion in exports from January to July 2026, up 33 percent year on year.
- Mining Around 73 percent of the total, at US$46.284 billion.
- Copper US$21.607 billion, up 43.3 percent.
- Gold US$16.394 billion, up 56.9 percent.
- Together Copper and gold alone are roughly 60 percent of everything Peru sold abroad.
- The caveat This is seven months of data, not a full year to date through August.
Peru’s export boom is real and it is two metals. Copper and gold are close to two thirds of the total, and both are running on price.
Peruvian exports reached US$63.521 billion in the first seven months of 2026, a rise of 33 percent, with copper and gold accounting for roughly 60 percent of the total.
The Composition
Mining products account for around 73 percent of exports over the period, at US$46.284 billion. Copper contributed US$21.607 billion, up 43.3 percent.
Gold contributed US$16.394 billion, up 56.9 percent. Between them the two metals come to roughly US$38 billion.
The period covered is January to July 2026, seven months. Figures circulating as year to date through August are describing a different window.
What Is Driving It
Gold rising 56.9 percent by value in seven months is a price story rather than a volume story. Peruvian gold production has not grown by anything like that rate.
Copper is a mixture. Prices have been strong and Peru has had production additions come through, but the 43.3 percent figure is well ahead of any plausible output growth.
That distinction determines how durable the surge is. Export revenue built on price reverses when price does, and it does not leave behind the capacity that volume growth builds.
Live Market IntelligenceCommodities — Live Market Board
Rio Times · Live Market Intelligence
Commodities — Live Market Board
-0.84%
| Instrument | Last | Change | YoY | Prev. | High | Low | Volume |
|---|---|---|---|---|---|---|---|
| GOLD | 4,027 | -2.13% | -2.31% | 4,115 | 4,156 | 4,021 | 154,960 |
| SILVER | 51.19 | -2.61% | +2.02% | 52.56 | 53.78 | 51.14 | 46,730 |
| BRENT | 91.79 | -0.84% | +43.29% | 92.57 | 92.82 | 89.15 | 28,589 |
| WTI | 86.30 | -0.63% | +43.52% | 86.85 | 86.93 | 83.88 | 199,691 |
| COPPER | 6.22 | -1.66% | +22.34% | 6.33 | 6.40 | 6.22 | 40,874 |
| LITHIUM | 59.97 | -2.25% | -3.80% | 61.35 | 60.72 | 59.81 | 109,140 |
| IRON ORE | 161.91 | — | +55.73% | 161.91 | 161.91 | 1 | |
| SOY | 1,223 | +3.40% | +9.54% | 1,182 | 1,231 | 1,185 | 140,502 |
| CORN | 450.75 | +2.62% | +4.89% | 439.25 | 455.50 | 438.75 | 251,027 |
| WHEAT | 593.25 | +0.89% | +10.73% | 588.00 | 599.75 | 585.25 | 67,098 |
| COFFEE | 266.90 | -2.45% | -35.65% | 273.60 | 269.00 | 265.30 | 17,662 |
| SUGAR | 18.04 | -0.93% | +27.04% | 18.21 | 18.29 | 17.92 | 65,697 |
| COCOA | 4,870 | -2.68% | -20.19% | 5,004 | 5,053 | 4,764 | 32,180 |
| ORANGE JUICE | 147.75 | +6.79% | -18.68% | 138.35 | 148.20 | 142.90 | 772 |
| COTTON | 78.28 | -0.63% | +21.72% | 78.78 | 79.90 | 78.63 | 34,150 |
| BEEF | 222.53 | +2.93% | -2.64% | 216.20 | 222.65 | 219.28 | 20,879 |
| CATTLE | 325.50 | -0.87% | -3.02% | 328.35 | 325.98 | 322.15 | 5,886 |
| USD/BRL | 5.59 | +1.55% | +4.93% | 5.51 | 5.61 | 5.51 | — |
The Concentration Question
Two commodities at 60 percent of exports is a familiar Peruvian position and a familiar Peruvian vulnerability. It makes fiscal revenue, the current account and the exchange rate all functions of the same two prices.
It also sits awkwardly against a separate warning this week. Alonso Segura, president of Peru’s Fiscal Council, said the country enters an El Niño period with its financial-asset savings at their lowest level in around 25 years, despite record commodity prices.
Earning record export revenue while saving less of it is the structural problem underneath a very good set of trade numbers.
The Mines Behind the Numbers
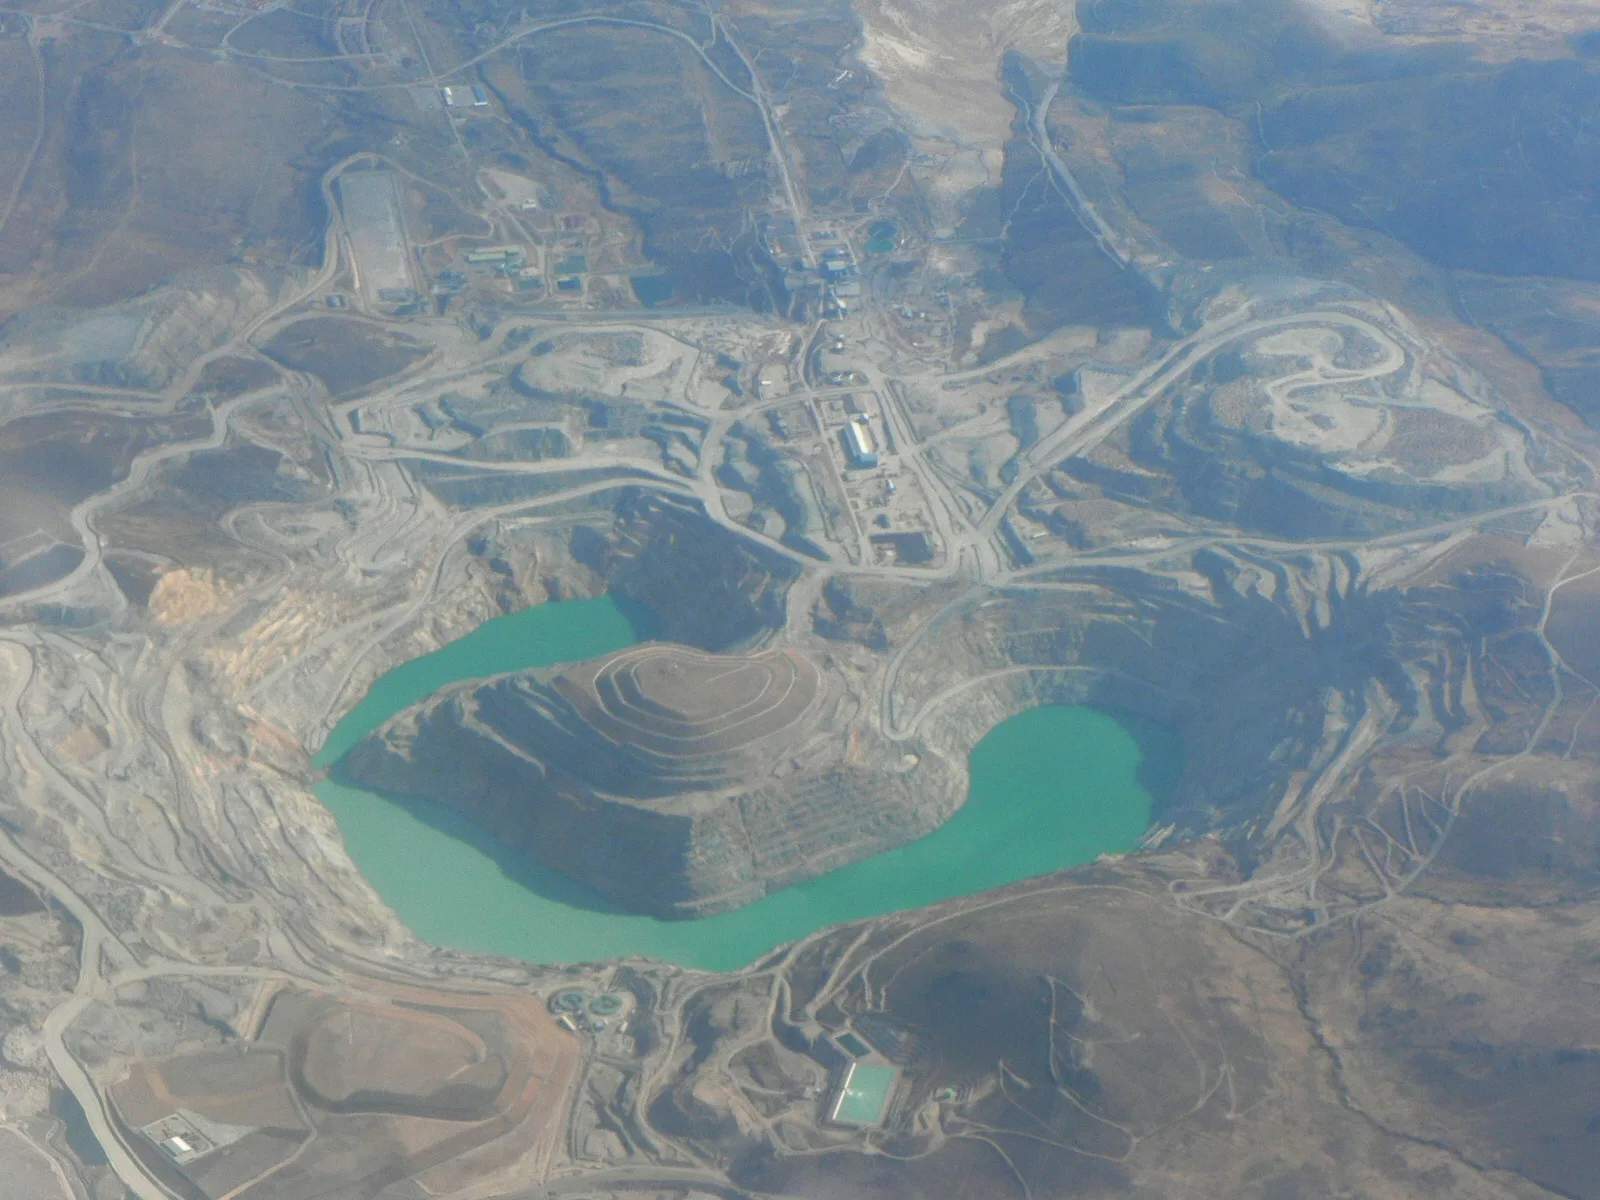
Peru is the world’s third-largest copper producer after Chile and the Democratic Republic of Congo. Its output is concentrated in a small number of very large operations: Cerro Verde, Antamina, Las Bambas, Toquepala and Cuajone.
That concentration is a permanent feature of the export data. A single mine going into maintenance, or a single road blockade in Apurímac, moves national export figures in a way that would be impossible in a diversified economy.
Gold is more dispersed. Peru has large formal operations at Yanacocha and Poderosa, and a substantial informal and illegal sector, particularly in Madre de Dios, whose output enters the export statistics through channels that are not always traceable.
That second point deserves care when reading a 56.9 percent increase in gold exports. Some of the growth is price, some is formal production, and a portion is gold whose origin is disputed.
What It Means for the Budget
Mining royalties and corporate tax on mining companies are a substantial share of Peruvian fiscal revenue, and they rise and fall with the same prices that drive the export line.A year of exceptional metal prices should therefore be a year of exceptional revenue, and it should be the year a country rebuilds its stabilisation fund.
That has not happened, which is the substance of the Fiscal Council’s warning this week that financial-asset savings are at their lowest in around 25 years. Peru had a strong reputation for exactly this discipline before 2016.
The erosion since is a political story rather than an economic one.
The Risk in the Second Half
Copper prices have been supported through 2026 by supply disruption and by demand tied to electrification. Neither support is guaranteed to hold.
Gold has been carried by geopolitical risk and by central bank buying. The Middle East escalation that pushed Brent above US$100 in early September is part of the same trade.
A country whose export earnings, fiscal revenue and currency all depend on two prices set in London and Shanghai is exposed in a specific and familiar way. The seven-month figures are excellent.
They are not evidence that the exposure has changed.
More: Peru news in English, every day from The Rio Times.
Frequently Asked Questions
How much did Peru export?
US$63.521 billion from January to July 2026, up 33 percent year on year.
What share is mining?
Around 73 percent, at US$46.284 billion.
How much is copper and gold?
Copper US$21.607 billion, up 43.3 percent. Gold US$16.394 billion, up 56.9 percent. Together roughly 60 percent of exports.
Is this price or volume?
Largely price. The percentage increases far exceed plausible production growth, particularly in gold.
What period does it cover?
Seven months, January to July 2026.
Sources: La República, Gestión.
This article was produced by The Rio Times’ automated AI newsroom. Editorial responsibility: Matthias Camenzind, Publisher and Editor-in-Chief. The Rio Times also runs Ask Rio Times, which answers from 100,000+ of our own articles, the daily Latin America Power Map, and prediction-market odds on elections and markets.. How we use AI · Report an error