Nearly 4 in 10 Peruvians Face Energy Poverty
A new index counts who lacks clean cooking, reliable power and basic appliances, and finds the divide runs between regions and between town and countryside.

Energy: Peru
Nearly four in 10 Peruvians, about 12.5 million people, live in energy poverty, according to the country’s first index of its kind, presented on Thursday 19 November 2026. The study, called IMPE Perú, was produced by Promigas, a Colombian gas pipeline and distribution group.
It asks not only whether a home has electricity but whether it can cook cleanly, keep food cold and connect to the wider world. In the region of Huancavelica, 82.7% of people are energy-poor, against 5.1% in Lima.
Key Facts
- Who. Promigas, a Colombian gas group, with Inclusión SAS (research firm) and IDB Invest (development bank arm).
- What. IMPE Perú, the first national index of multidimensional energy poverty, with data for 2025.
- Numbers. 38% of Peruvians, about 12.5 million, are energy-poor; Huancavelica 82.7%, Lima 5.1%.
- Power Index. Peru ranks 5th of 14 in The Rio Times Latin America Power Index, with 53.9 points (November 2026 edition).
- As of. 20 November 2026, 11:30 GMT
A new index counts who lacks clean cooking, reliable power and basic appliances, and finds the divide runs between regions and between town and countryside.
IMPE Perú is short for Índice Multidimensional de Pobreza Energética del Perú, the Multidimensional Energy Poverty Index of Peru. Promigas built it with Inclusión SAS, a research consultancy, and with support from IDB Invest, the private-sector arm of the Inter-American Development Bank, and Apoyo Consultoría, a consultancy.
The figures are for 2025 and rest on ENAHO, the national household survey run by Peru’s statistics institute, INEI. Promigas published a first version of the index for Colombia in September 2023, which found 18.5% of Colombians, about 9.6 million people, in energy poverty, and the Promigas group has now turned to Peru.
Roberto Angulo, founding partner of Inclusión SAS, which co-built the index, defines an energy-poor person as someone whose household accumulates weighted deprivations equal to 30% or more of the indicators measured. The index covers four dimensions: access to and quality of energy, learning and communicating, functional housing that frees up time, and a territory equipped for wellbeing.
Indicators range from electricity access to owning a washing machine or having a gas or electric stove, 15 in total. Among the energy-poor, 71.3% have no washing machine, 62.1% no computer or tablet and 42.5% no refrigerator.
Huancavelica has the highest rate at 82.7%, followed by Huánuco at 82.4% and Loreto at 79.9%. At the other end are Lima at 5.1%, Callao at 6.3% and Ica at 10.8%, a gap of 77.6 percentage points between the extremes.
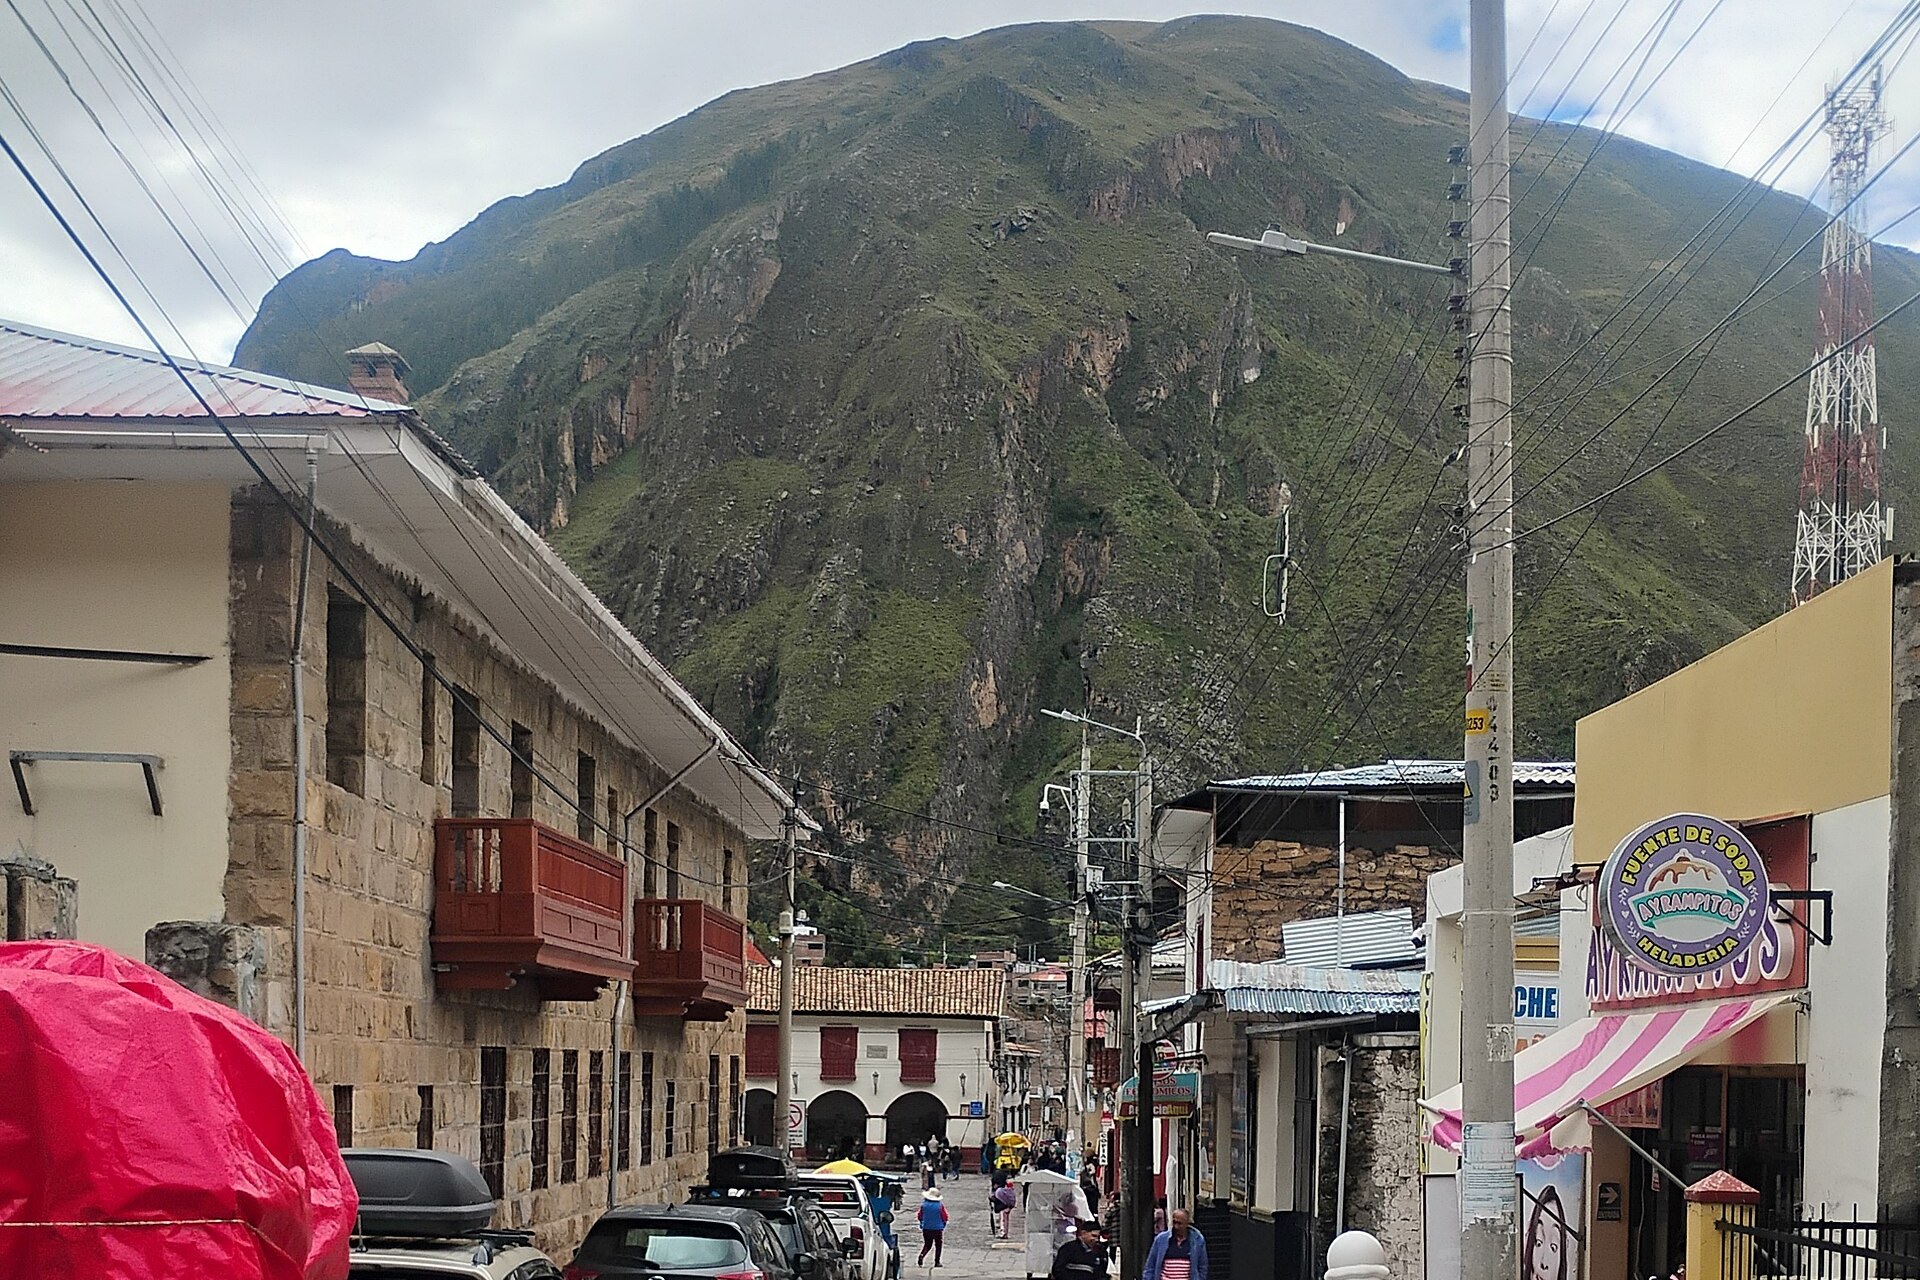
The divide also separates town from countryside: 92.2% of rural Peruvians are energy-poor, against 27% in urban areas. Nearly 8 million Peruvians, 22.8% of the population, lack gas or another clean source for cooking, the study finds.
Supply quality is part of the picture. About 35.5% of Peruvians live in districts where power cuts exceed the study’s threshold.
Promigas’s Colombian index found 18.5% of people energy-poor in 2022, then 16.1% in 2023 and 15.4% in 2024, so Peru’s 38% is about two and a half times the latest Colombian rate. The comparison is a rough guide, since the surveys and years differ.
The finding closest to Promigas’s own business concerns gas. In districts served by its natural-gas distribution companies, 7.6% of people are energy-poor, against 56.7% in the rest of the country.
Promigas sells gas, and the figures compare districts. They show where gas and lower deprivation coincide, not that gas connections caused the gap.
Juan Manuel Rojas, president of Promigas, called for reviving FISE, the Social Energy Inclusion Fund. He also asked for Bonogas, the gas-connection vouchers that the fund financed.
Carlos Salazar, vice minister of Social Policies and Evaluation at the Ministry of Development and Social Inclusion (Midis), welcomed the study as key to more targeted policy. No programme or budget has been announced.
Promigas has also filed an arbitration request against Peru at ICSID, the World Bank Group’s International Centre for Settlement of Investment Disputes, over gas tariffs. That makes the group both the author of this study and a company in a dispute with the state.
No cost estimate for closing the gap has been announced so far. The next test is whether the ministry turns its welcome into a programme.
Frequently Asked Questions
What does energy poverty mean in this index?
It means a household lacks a weighted share of basics, from dependable electricity to clean cooking and everyday appliances. The measure goes beyond a simple connection to the grid.
Does the gas finding show gas cures energy poverty?
Not on its own, because the comparison is between districts and the authors are a gas company and its research partners. It shows where gas and lower deprivation coincide.
Will the government act on the index?
The ministry has welcomed it but has announced no programme. Any change would depend on a later budget decision.
Sources
IMPE Perú study (Promigas, Inclusión SAS, IDB Invest, Apoyo Consultoría), presented 19 November 2026; ENAHO household survey (INEI); statements by Promigas and the Ministry of Development and Social Inclusion. Promigas · INEI · Midis · IDB Invest
Connected Coverage
Peru news · Promigas Says 4 Peru Gas Projects Wait · Colombia’s Promigas Takes Peru to a World Bank Tribunal · Promigas company profile
This article was produced by The Rio Times’ automated AI newsroom. Editorial responsibility: Matthias Camenzind, Publisher and Editor-in-Chief. The Rio Times also runs Ask Rio Times, which answers from 100,000+ of our own articles, the daily Latin America Power Map, and prediction-market odds on elections and markets.. How we use AI · Report an error