IBOV 177,418.78 ▲ 1.00% IPSA 11,315.26 ▼ 1.14% IPC MEX 65,048.39 ▼ 0.67% MERVAL 3,033,848 ▲ 1.83% COLCAP 2,425.08 ▼ 1.33% BVL PERÚ 59,928.30 ▼ 0.80% USD/BRL5.18▼ 0.21% USD/MXN17.00— 0.00% USD/CLP933.85▲ 0.25% USD/COP3,219▲ 0.60% USD/PEN3.36▼ 0.12% USD/ARS1,509▼ 0.28% USD/UYU40.29▲ 0.05% USD/PYG5,892▼ 0.13% USD/BOB11.84▲ 0.51% USD/DOP58.64▲ 0.05% USD/CRC446.47▼ 0.04% USD/GTQ7.62▼ 0.02% USD/HNL26.84— 0.00% USD/NIO36.62▲ 0.14% USD/VES796.33▲ 0.29% USD/PAB1.00— 0.00% USD/BZD2.00— 0.00% USD/JMD 157.28 — 0.00% USD/TTD6.69▼ 0.37% EUR/BRL6.01▼ 0.24% BRENT 88.88 ▼ 0.03% WTI 83.11 ▼ 0.11% IRON ORE 161.91 — — COPPER 6.61 ▲ 0.03% GOLD 4,461 ▲ 1.78% SILVER 65.59 ▲ 1.26% SOY 1,184 ▲ 3.20% CORN 480.50 ▲ 10.02% WHEAT 655.00 ▲ 3.93% COFFEE 317.25 ▼ 5.51% SUGAR 16.43 ▼ 1.79% ORANGE JUICE 138.55 ▼ 0.47% COTTON 85.03 ▲ 2.33% COCOA 5,719 ▲ 3.18% BEEF 223.60 ▼ 3.93% CATTLE 339.10 ▼ 3.16% LITHIUM 75.20 ▲ 1.47% PETR4 41.64 ▼ 0.05% VALE3 72.97 ▲ 0.83% ITUB4 38.60 ▼ 1.03% BBDC4 16.85 ▲ 0.36% ABEV3 14.89 ▼ 0.80% BBAS3 19.37 ▲ 0.47% B3SA3 14.26 ▼ 0.21% WEGE3 47.59 ▲ 0.49% PRIO3 59.14 ▼ 0.19% SUZB3 41.33 ▲ 2.35% RENT3 34.68 ▼ 0.09% AZZA3 15.89 ▼ 2.63% CSAN3 3.22 ▼ 1.83% RAIZ4 0.25 — 0.00% PCAR3 2.75 ▼ 0.36% GMAT3 3.65 ▼ 1.08% PSSA3 48.13 ▼ 0.54% CVCB3 1.33 ▼ 2.92% POSI3 3.36 ▲ 2.44% SLCE3 13.34 ▲ 0.30% NATU3 8.14 ▼ 0.73% IBOV 177,418.78 ▲ 1.00% IPSA 11,315.26 ▼ 1.14% IPC MEX 65,048.39 ▼ 0.67% MERVAL 3,033,848 ▲ 1.83% COLCAP 2,425.08 ▼ 1.33% BVL PERÚ 59,928.30 ▼ 0.80% USD/BRL 5.16 ▲ 0.01% USD/MXN 17.06 ▼ 0.24% USD/CLP 913.98 ▲ 0.04% USD/COP 3,140 ▲ 0.03% USD/PEN 3.36 ▼ 0.66% USD/ARS 1,493 ▲ 0.10% USD/UYU 40.27 ▲ 1.24% USD/PYG 5,939 ▲ 1.68% USD/BOB 11.64 ▼ 0.76% USD/DOP 58.34 ▲ 1.25% USD/CRC 445.92 ▲ 0.89% USD/GTQ 7.62 ▲ 2.21% USD/HNL 26.79 ▲ 1.57% USD/NIO 36.62 ▲ 0.69% USD/VES 762.44 ▼ 0.13% USD/PAB 1.00 — 0.00% USD/BZD 2.00 — 0.00% USD/JMD 157.28 — 0.00% USD/TTD 6.70 ▲ 0.61% EUR/BRL 5.95 ▲ 1.01% BRENT 88.88 ▼ 0.03% WTI 83.11 ▼ 0.11% IRON ORE 161.91 — — COPPER 6.61 ▲ 0.03% GOLD 4,461 ▲ 1.78% SILVER 65.59 ▲ 1.26% SOY 1,184 ▲ 3.20% CORN 480.50 ▲ 10.02% WHEAT 655.00 ▲ 3.93% COFFEE 317.25 ▼ 5.51% SUGAR 16.43 ▼ 1.79% ORANGE JUICE 138.55 ▼ 0.47% COTTON 85.03 ▲ 2.33% COCOA 5,719 ▲ 3.18% BEEF 223.60 ▼ 3.93% CATTLE 339.10 ▼ 3.16% LITHIUM 75.20 ▲ 1.47% PETR4 41.64 ▼ 0.05% VALE3 72.97 ▲ 0.83% ITUB4 38.60 ▼ 1.03% BBDC4 16.85 ▲ 0.36% ABEV3 14.89 ▼ 0.80% BBAS3 19.37 ▲ 0.47% B3SA3 14.26 ▼ 0.21% WEGE3 47.59 ▲ 0.49% PRIO3 59.14 ▼ 0.19% SUZB3 41.33 ▲ 2.35% RENT3 34.68 ▼ 0.09% AZZA3 15.89 ▼ 2.63% CSAN3 3.22 ▼ 1.83% RAIZ4 0.25 — 0.00% PCAR3 2.75 ▼ 0.36% GMAT3 3.65 ▼ 1.08% PSSA3 48.13 ▼ 0.54% CVCB3 1.33 ▼ 2.92% POSI3 3.36 ▲ 2.44% SLCE3 13.34 ▲ 0.30% NATU3 8.14 ▼ 0.73%
since 2009
Tuesday, September 1, 2026

Brazil Business - Brazil

Brazil’s Real Estate Investment Trusts Face Steepest Decline in Two Years

By · October 7, 2024 · 2 min read

Daily Brief

The morning intel from across Latin America. Free.

By subscribing you agree to our privacy policy. We never share your email.

Brazil’s real estate investment trusts (REITs) experienced their most significant drop in two years this September. The monetary tightening in Brazil has affected these funds, pushing the sector’s benchmark index into negative territory for 2024.

The index’s decline has resulted in a 0.16% loss for the year so far. This small decrease follows several consecutive increases in the first half of 2024. During that period, REITs saw R$ 20 billion in offerings on the B3 stock exchange.

REITs continued to advance in July and August, driven by funds focused on real estate receivables. These “paper funds” have shown the best performance this year, with a 3.4% increase.

Larissa Gatti Nappo, an analyst at Itaú BBA, notes the renewed investor interest in this category. Flávio Pires, a REIT analyst at Santander, recommends a more defensive portfolio to preserve dividends.

He suggests hybrid funds with long-term contracts from large companies and reduces exposure to products negatively impacted by the Selic rate.
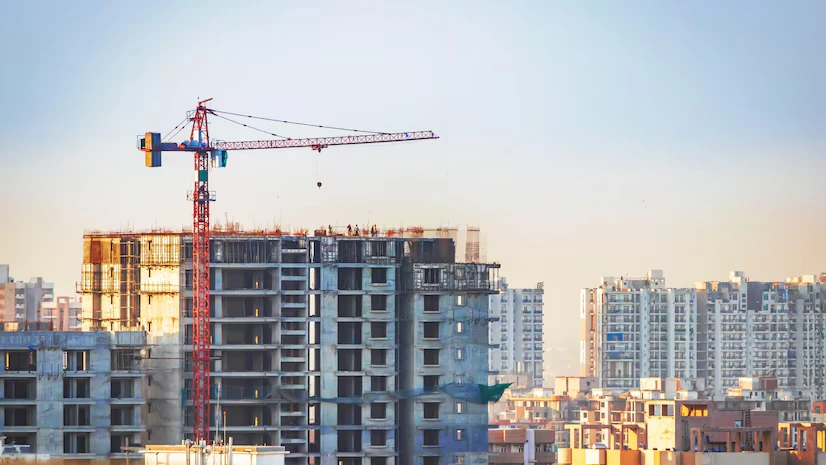
Brazil's Real Estate Investment Trusts Face Steepest Decline in Two Years
Brazil’s Real Estate Investment Trusts Face Steepest Decline in Two Years. (Photo Internet reproduction)
One-stop reference
Company Intelligence
Every listed company in Latin America — financials, ownership and structure for 1,450+ companies across 26 exchanges, in one place.
Browse the directory →
RT
Ask Rio Times
Latin American markets, currencies and companies.
Open the full Ask Rio Times →

BTG Pactual has also adopted a conservative approach to its portfolio. They have reduced funds with greater exposure to inflation indices and increased those indexed to the CDI.

For “brick funds,” which hold real assets, they prefer more diversified options. Among brick funds, office-focused REITs have performed the worst, with quotations falling 8.8% this year.

However, this decline reflects weak data, with São Paulo’s office vacancy rate rising slightly to 21.4% in Q1 2024. Rio de Janeiro’s vacancy rate remains above 30%.

Impact of Rising Interest Rates on REITs

The rise in future interest rates has increased the attractiveness of government bonds, putting REITs at a disadvantage.

Higher interest rates have also negatively impacted shopping mall funds, which have declined 3.7% this year through September.

Logistics warehouse funds, a favorite among managers, have remained nearly flat with a slight 0.1% increase from January to September 2024.

The sector’s vacancy rate improved to 9% in Q2 2024, one of the lowest historically. Office REITs show the largest discount between market value and book value at 30%.

Logistics funds have a 12% discount, shopping malls 10%, financial asset funds 9%, and fund of funds 6%. BTG Pactual‘s report highlights dividend yields, with multi-strategy funds offering the highest average at 12.8% per year.

In short, real estate receivables funds follow at 12.3%, and urban income funds at 11.5%. Logistics warehouses average 10.3%, corporate slabs 10.5%, and shopping malls 9.1%.

This article was drafted with automated assistance and reviewed before publication. How we use AI · Report an error

LatAm Markets: Live Signals → — real-time movers, turnover leaders and FX across Latin America.

Read More from The Rio Times

The Rio Times · Power Map
See who really holds power in Latin America
Click to open the Power Map

Rotate for Best Experience

This report is optimized for landscape viewing. Rotate your phone for the full experience.