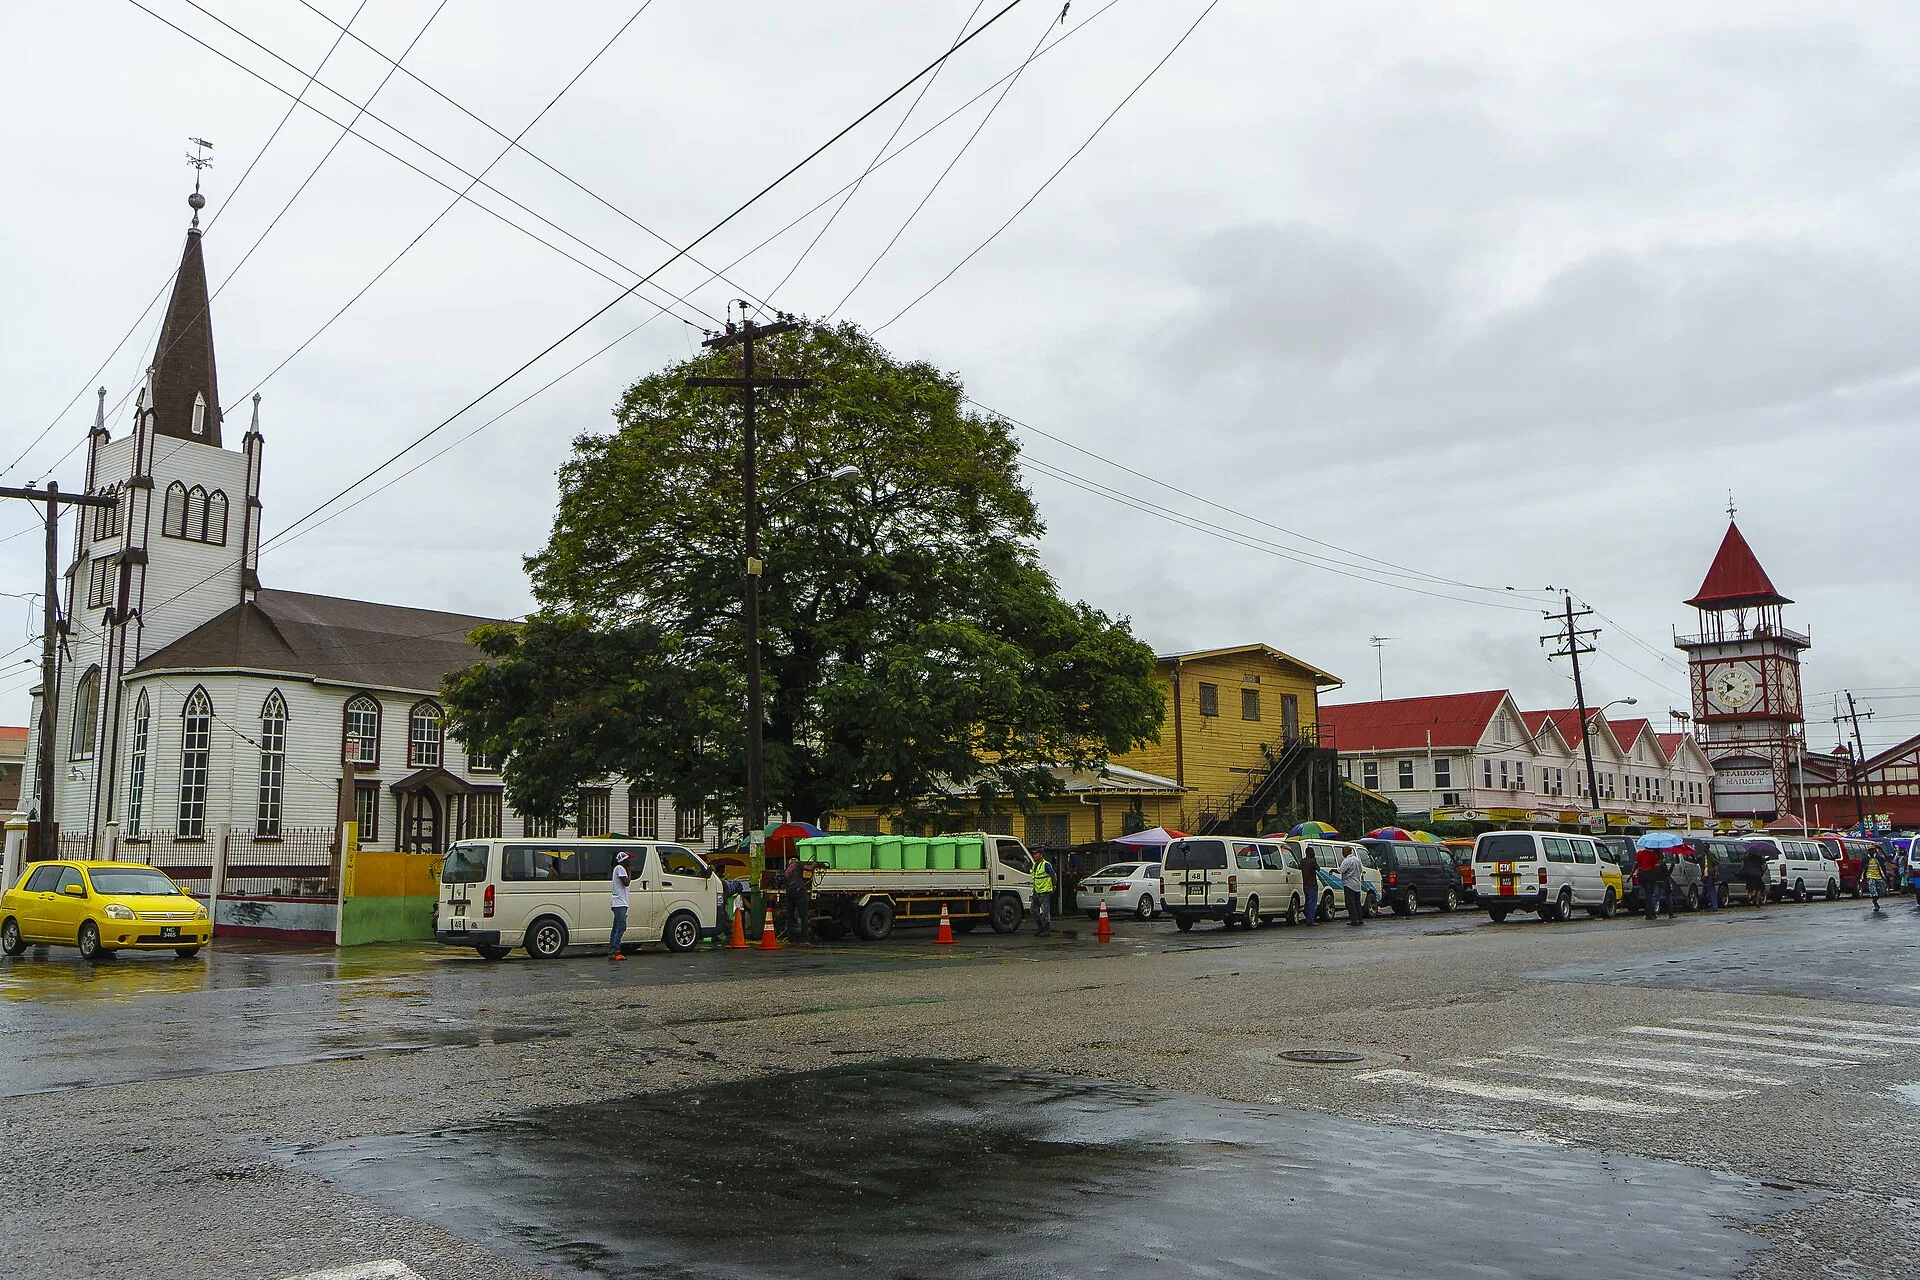
The Commonwealth Secretariat, the administrative body of the 56-nation Commonwealth, estimates in a new report that about US$43.5 billion of Guyana’s assets are exposed to flooding, because oil-driven growth is piling more buildings and infrastructure onto a coast that lies below high-tide level. The report, published on 21 October 2026, describes this as estimated exposure to episodic flooding, not damage that has already happened.
For US readers, Guyana is the country where a group led by ExxonMobil, the US oil major, pumps oil offshore, and the report argues that the same oil economy is raising the stakes onshore. The Commonwealth is a group of 56 independent countries, most of them former British territories.
Key Facts
- Figure. Guyana’s estimated asset exposure to episodic flooding is about US$43.5 billion.
- Cause. Oil-driven growth is concentrating more assets and economic activity on the coast.
- Land. About 90% of Guyanese live on a coastal plain 0.5 to 1 metre below sea level at high tide.
- Sea level. Estimates at Georgetown, the capital, show a rise of 4.7 to 10.2 mm a year, against 3.2 to 3.5 mm globally.
- Fund. Guyana’s state oil savings fund held about US$3.6 billion at the end of September 2025.
Economic success can deepen risk, the report warns, because exposure rises with development. That is the pattern it sees in Guyana’s oil economy.
What the Commonwealth Found
The Commonwealth Secretariat compared five low-lying member countries: Guyana and four Pacific nations, Kiribati, Papua New Guinea, Tonga and Tuvalu. Its report says that in each of them most people, infrastructure and economic activity sit in a narrow coastal strip.
For Guyana, it says the oil-driven boom is concentrating still more assets on the coast and lifting estimated exposure to around US$43.5 billion. It adds that adaptation which only maintains today’s risk level becomes more costly each year as the value behind the defences grows.
Why Guyana’s Coast Is So Exposed
Guyana’s coastal plain lies 0.5 to 1 metre below sea level at high tide, and about 90% of the population and more than half of national output sit on it. The report says Guyana’s challenge is surging asset exposure during an oil-driven transition, with fragmented coastal-zone governance.
Estimates from the Georgetown tide gauge put the local sea-level rise at 4.7 to 10.2 millimetres a year, well above the global average of about 3.2 to 3.5. The report says land sinking and coastal erosion can amplify the rise in the five countries.
Guyana lost roughly 70% of its mangrove cover between 1992 and 2015, the report says, which shows how fast development can erode a natural sea defence. It also says Guyana still lacks comprehensive coastal-zone management law and enforceable building codes.
Oil Money Could Pay for Defences
Guyana is the exception among the five on funding, the report says. Offshore oil revenue paid into its Natural Resource Fund, the state oil savings fund, which held about US$3.6 billion by September 2025, gives it fiscal space that the Pacific island states lack.
Whether that money goes to adaptation depends on national budget priorities, and the same oil economy is what is driving up coastal exposure. None of the five countries yet has adaptation governance and finance arrangements adequate to the scale of the threat.
What It Means for You
For investors and companies with assets in Georgetown and along the coast, the report is a prompt to ask how flood risk is priced and insured. For Guyanese households, the practical question is whether oil revenue turns into drainage, sea walls and mangrove protection.
Our reports on Guyana’s oil budget and food costs and on the local content act show how the same oil money is being argued over. See also our Guyana coverage.
What Is Not Known
The US$43.5 billion is an estimate of assets exposed to flooding, not a forecast of losses, and it will change as Guyana’s economy grows. Nothing in the figure says when such flooding might happen.
How much oil revenue goes to coastal defence is left to national budget priorities. That choice is still open.
Frequently Asked Questions
How much of Guyana’s property is at flood risk?
The Commonwealth Secretariat estimates asset exposure to episodic flooding at around US$43.5 billion. That is the value of what could be affected, not a forecast of losses.
Why is Guyana so exposed to flooding?
Its coastal plain lies 0.5 to 1 metre below sea level at high tide, and about 90% of the population lives there. Sea level at Georgetown is rising faster than the global average.
Who published the report on Guyana and sea-level rise?
The Commonwealth Secretariat published it on 21 October 2026 as a common-themes report on five countries. It was commissioned by the secretariat’s Climate Change and Oceans Directorate, its climate and ocean policy unit.
Sources
Commonwealth Secretariat, Commonwealth Case Studies on Sea Level Rise: Common Themes Report, 21 October 2026 · Report PDF. Read on 8 November 2026.
This article was produced by The Rio Times’ automated AI newsroom. Editorial responsibility: Matthias Camenzind, Publisher and Editor-in-Chief. How we use AI · Report an error