Wheat Fund Falls 1.57% as Corn Slips 0.98% | Grains, Nov 3

Key Facts
- Wheat and corn sank to three-month lows. The wheat-tracking fund WEAT closed at US$21.93 (-1.57%) and the corn-tracking fund CORN at US$17.19 (-0.98%) on Tuesday, 3 November 2026.
- Soybeans fell too, more gently. The soybean-tracking fund SOYB has now lost ground for two sessions in a row and is down 7.14% over 20 sessions.
- Supply is the main culprit. The US harvest is nearly finished, and Conab, Brazil’s national crop-supply agency, expects a record 181.6 million tonnes of soybeans in 2026/27.
- China is shopping in South America. Chinese buyers have already booked 9.04 million tonnes of Brazil’s 2026/27 soybeans, ahead of purchases from the United States.
- Wheat has fallen furthest. European wheat futures sit near multi-month lows as peace talks cool fears of disrupted supply.
- Latin America gets a split verdict. Exporters in Brazil and Argentina earn less per tonne, while grain importers such as Mexico and Peru pay less.
Today’s Focus
Grain prices slid again on Tuesday, 3 November 2026, and wheat and corn closed at their lowest levels in at least three months. The wheat-tracking fund now sits 21.7% below its 28 August high, and the corn-tracking fund 15.3% below its 1 September high.
The cause is plain: farmers are harvesting a very large crop, and there is more grain than buyers need. The US corn and soybean harvest is close to done, and Brazil, the world’s biggest soybean exporter, is preparing a record planting.
China, the largest buyer, is leaning on Brazil and Argentina rather than the United States. That leaves US farmers with heavy stocks and South American growers with the customers.
What matters today. Cheap grain squeezes farm incomes in Brazil and Argentina but lowers food and feed costs for importers across the region.
01 The session in one read
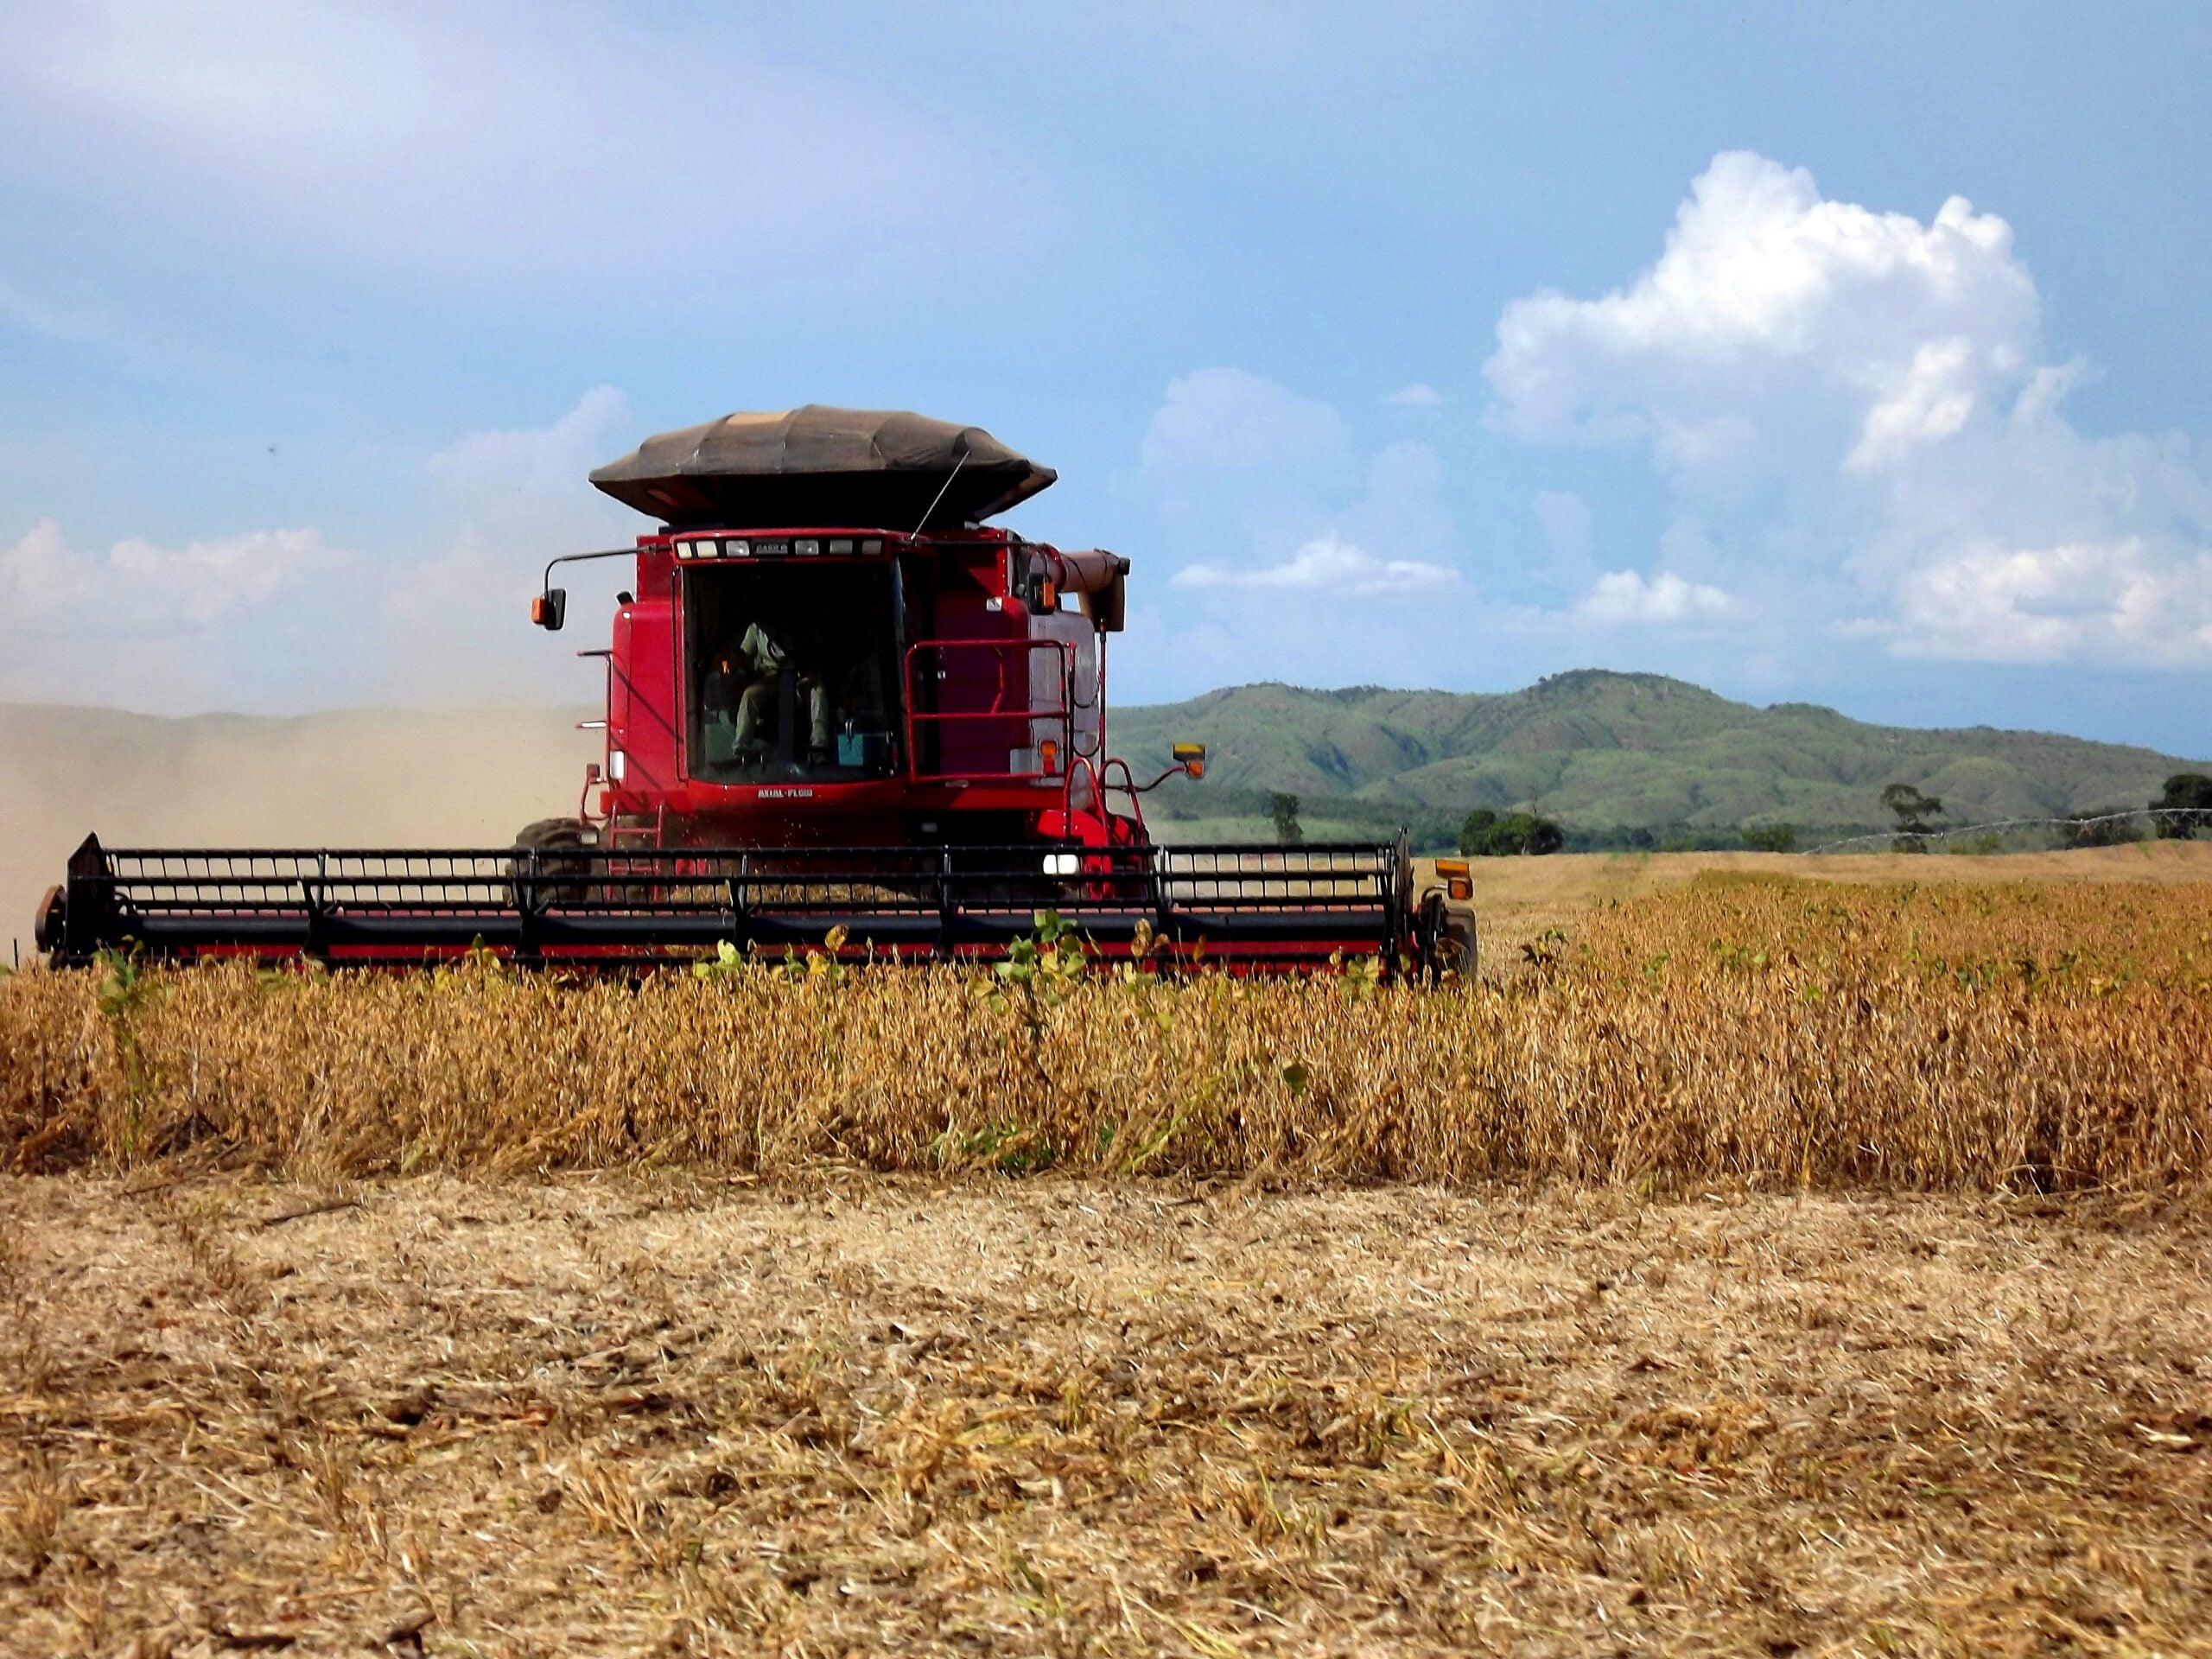
Harvest season is when grain markets feel heaviest, because every field sends its crop to market at once. Tuesday, 3 November 2026 was a textbook example.
In the United States, the corn and soybean harvest is nearly complete, and traders are waiting for the next crop estimates from the US Department of Agriculture, the USDA. Larger supplies were the main reason corn prices slipped.
Brazil, meanwhile, is planting what Conab expects to be a record: 181.6 million tonnes of soybeans from 49.3 million hectares. That area is 1.4% larger than the year before.
The drop has the look of a seasonal supply squeeze rather than a collapse in demand, since the dollar, bond yields and shares barely explain it. Wheat is the weakest link, corn is close behind and soybeans are holding up best, which is what a world awash in cereals would produce. The variable to watch is China’s pace of buying against the November USDA crop estimates.
02 The board
These prices are for exchange-traded funds that track each crop, not for the grain itself. The soybean-tracking fund SOYB slipped to US$25.75 (-0.23%), a modest loss next to its two cousins.
That calm is typical of soybeans right now: China has booked supply early and crushers have steady needs. Wheat and corn, which have fewer such anchors, took the heavier blows.
| Asset | Level | Change |
|---|---|---|
| Soybeans (SOYB) | US$25.75 | -0.23% |
| Corn (CORN) | US$17.19 | -0.98% |
| Wheat (WEAT) | US$21.93 | -1.57% |
Source: RT close, 2026-11-03. Where a commodity has no spot feed, an exchange-traded tracker or leading producer is shown as a labelled proxy.
Live Market IntelligenceThe live market board
Rio Times · Live Market Intelligence
Latin America — Cross-Market Board
| Instrument | Last | Change | YoY | Prev. | High | Low | Volume |
|---|---|---|---|---|---|---|---|
| IBOV | 165,528.92 | -1.42% | +19.56% | 167,921.80 | 178,526 | 175,157 | — |
| IPSA | 10,365.73 | -0.09% | — | 10,375.55 | 10,722 | 10,633 | — |
| IPC MEX | 70,848.90 | +1.53% | +12.74% | 69,779.20 | 70,008 | 69,383 | 49,372,306 |
| MERVAL | 2,848,945 | — | +12.65% | 2,859,051 | — | — | — |
| COLCAP | 2,527.66 | +1.47% | — | — | — | — | — |
| USD/BRL | 5.34 | -1.32% | -0.84% | 5.42 | 5.42 | 5.30 | — |
| EUR/BRL | 5.95 | +7.53% | -4.87% | 5.54 | 6.04 | 5.92 | — |
| USD/MXN | 18.69 | +0.62% | +1.45% | 18.57 | 18.69 | 18.54 | — |
| USD/CLP | 983.47 | -0.57% | +5.64% | 989.13 | 991.87 | 979.07 | — |
| USD/COP | 3,149 | +3.06% | -18.02% | 3,056 | 3,173 | 3,111 | — |
| USD/PEN | 3.45 | +0.17% | +3.85% | 3.44 | 3.45 | 3.44 | — |
| USD/ARS | 1,537 | -0.28% | +3.77% | 1,541 | 1,541 | 1,537 | — |
| USD/UYU | 40.21 | +3.57% | +2.29% | 38.83 | 40.21 | 40.08 | — |
| USD/PYG | 5,803 | +3.78% | -16.54% | 5,592 | 5,803 | 5,735 | — |
| USD/BOB | 11.97 | +4.93% | +77.92% | 11.41 | 11.97 | 11.82 | — |
| USD/DOP | 60.54 | +1.83% | -4.34% | 59.45 | 61.14 | 59.85 | — |
| USD/CRC | 451.24 | +2.13% | -7.80% | 441.83 | 451.40 | 450.04 | — |
| USD/GTQ | 7.64 | +3.23% | +2.18% | 7.40 | 7.64 | 7.64 | — |
03 Why it moved
Cause one, and the heaviest, is supply. Corn eased as larger supplies met a harvest nearing completion, and even decent export sales failed to lift it.
Cause two is China’s shift to South America. Chinese buyers have booked 9.04 million tonnes of Brazil’s 2026/27 soybeans in advance, while large domestic stocks and thin crushing margins hold back US purchases. The USDA still projects China’s 2026/27 soybean imports at 115.0 million tonnes, so the demand exists, but it is flowing south. Confidence: high.
Cause three, for wheat, is geopolitics. European wheat futures are near multi-month lows on peace talks, which investors read as easing the risk of disrupted shipments. Confidence: medium, because the link is inferred from price behaviour rather than from any trader’s statement.
The usual drivers only partly agree. The dollar index rose 0.14% to 101.89 and the 10-year US Treasury yield rose 7 basis points to 4.97%, which makes dollar-priced grain a little dearer abroad. Yet the S&P 500 gained 0.36% to 7,569 and the USO oil fund rose 0.83%, so there was no broad risk-off panic. The VIX fear gauge closed at 20.83. The grain slide is therefore its own story.
04 The trend behind it
This is a continuation, not a new phase. Soybeans are 8.5% below their 12-month high of 28.14 on 10 September, yet still 18.6% above the 21.71 low of 13 January.
Corn is down 10.89% over 20 sessions and sits 4.4% above its 12-month low of 16.47 on 29 June. Wheat is down 13.97% over 20 sessions and 8.7% over 60.
Our own history offers a rare calibration. After earlier falls this large, soybeans were higher 20 sessions later in 16 of 29 cases and corn in 11 of 20, with a median gain of 0.6% for both. The worst cases were falls of 7.8% and 7.7% respectively.
Wheat tells a harsher tale. After 13 earlier drops this size, it was higher 20 sessions later in only 4, with a median of -1.6% and a worst case of -16.6%. History is not a forecast.
05 What it means for Latin America
Brazil and Argentina sell grain in dollars, so every drop in price trims export revenue per tonne. Brazil’s record crop partly offsets that through volume, and a weaker real helps farmers whose costs are in reais.
Argentina’s grain exporters bring in the dollars that its economy relies on, so a prolonged slide matters more there than the daily figures suggest. We lack a verified real or peso level today, so treat the currency effect as direction only.
Importers gain. Mexico buys large quantities of US corn for tortillas and animal feed, and Peru relies on imported wheat and corn, so cheaper cereals ease food bills.
For a traveller or saver, the effect shows up slowly in bread, meat and poultry prices rather than overnight.
06 The names to watch
The three trackers, SOYB, CORN and WEAT, are the cleanest gauge for foreign investors. Conab in Brazil and the USDA in Washington set the official crop numbers that move them.
Among companies, Brazilian farmland group SLC Agrícola earns from soybean and corn prices, while grain traders and processors such as Bunge and ADM profit from volume and crushing margins.
07 What would end it
Nearby levels are clear. For soybeans, support is the round 25 mark and then the 21.71 low, with resistance at the 28.14 September peak.
Corn finds support at the 16.47 June low and faces resistance at its 20.29 high of 1 September. Wheat has resistance at its 28.00 high of 28 August and the round 20 mark as the next landmark below.
The dated catalyst is the USDA’s November crop estimate, followed by Brazil’s planting progress and further Chinese purchases. If China keeps buying mainly from South America, the glut persists, and a bad South American growing season is the one thing that would change the picture.
08 What to watch
- USDA November estimates: Any cut to US yields or stocks could stop the slide in corn and soybeans.
- China’s buying: Further bookings of Brazilian beans beyond 9.04 million tonnes would confirm the shift away from US supply.
- Brazil planting and weather: A weather scare in the Brazilian crop belt is the classic way to end a glut.
- Peace talks and wheat: Failed talks would revive supply fears for wheat, the weakest of the three.
Frequently Asked Questions
Why are grain prices falling?
A large harvest is arriving, the US crop is nearly gathered and Brazil is expected to produce a record. China is also buying more from South America.
Does the fall mean cheaper food?
Slowly. Lower grain costs reach bread, meat and poultry prices over months, not days.
Who gains and who loses in Latin America?
Exporters in Brazil and Argentina earn less per tonne, while importers such as Mexico and Peru pay less.
Are these prices for actual grain?
No. They are for exchange-traded funds that track soybeans, corn and wheat, so they follow grain but are not the grain price itself.
Market data: The Rio Times
This article was produced by The Rio Times’ automated newsroom system. How we use AI · Report an error · Editorial responsibility: Matthias Camenzind, Editor-in-Chief
LatAm Markets: Live Signals → — real-time movers, turnover leaders and FX across Latin America.