Soybeans, Corn Slip While Wheat Rises on China Hopes
Key Facts
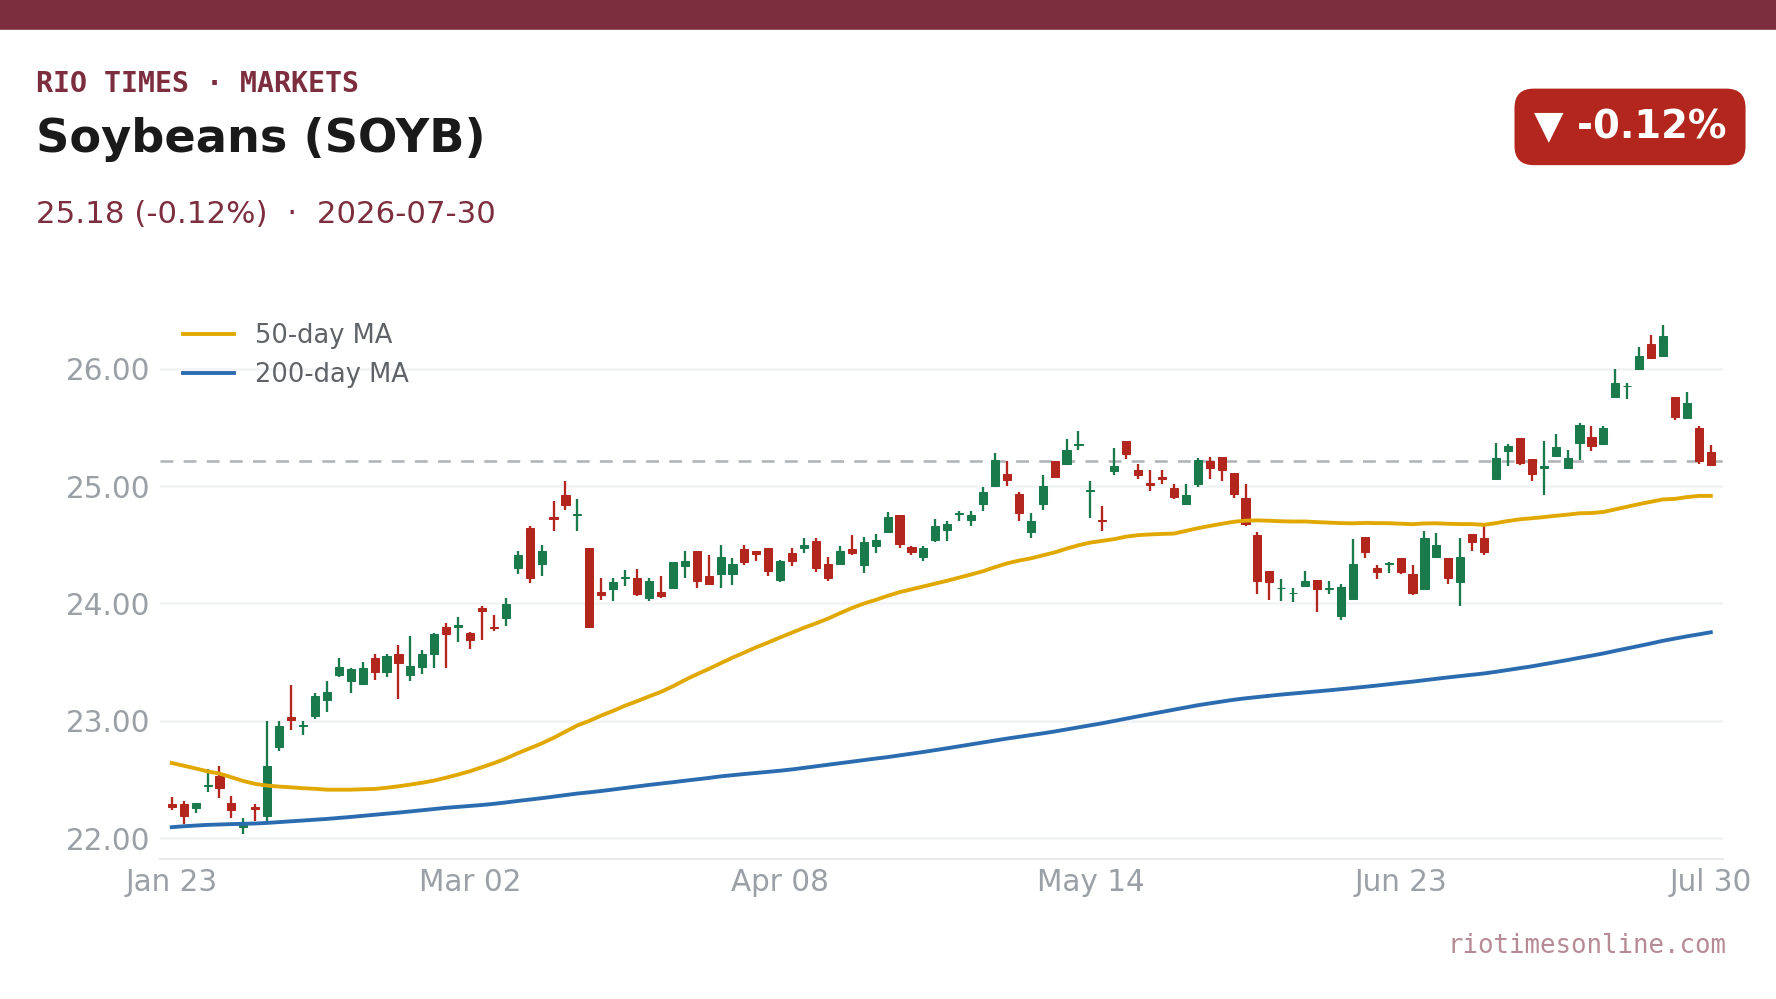
- The soybean-tracking fund SOYB slipped 0.12% settling at US$25.18 as softer oilseed pricing kept the fund in a defensive crouch.
- The corn-tracking fund CORN fell 0.39% to US$17.76, marking the steepest decline among the three major row-crop proxies on the day.
- The wheat-tracking fund WEAT bucked the trend with a 0.49% gain closing at US$24.62 and standing alone in positive territory for the session.
- U.S. Midwest weather and revived Chinese demand hopes are the twin engines driving the narrative around soybeans, which traded near US$11.6 per bushel in recent market commentary.
- Brazil and Argentina remain the world’s indispensable export corridor for corn and soybeans even as specific daily shipment data was not confirmed in Thursday’s trade.
- The Brazilian real’s rhythm against the dollar acts as a hidden throttle on farmer selling though no verified spot currency fixing was available for the latest session.
Today’s Focus
A split session unfolded on Thursday across the three global grain trackers. The soybean fund SOYB dipped 0.12% to US$25.18 and the corn fund CORN shed 0.39% to US$17.76, while the wheat fund WEAT climbed 0.49% to US$24.62. The moves paint a picture of a market weighing ample South American supply against uneven demand signals from Asia.
Soybean pricing drifted lower as traders balanced U.S. Midwest crop weather against the persistent hope that China will step up purchases. Recent benchmarks show the oilseed trading around US$11.6 per bushel in U.S. markets, a level that keeps pressure on the SOYB proxy.
Corn’s steeper 0.39% decline reflects the weight of expectations that Brazil’s safrinha harvest and Argentina’s recovery will keep global feed-grain bins comfortably full. The export engine of the Southern Cone is functioning at high capacity, which tends to cap rallies in the CORN fund.
Wheat’s isolated 0.49% gain in the WEAT fund suggests a separate anxiety over northern hemisphere supplies. U.S. Wheat Associates posted September CBOT soft red winter wheat at US$6.00 per bushel and Kansas City hard red winter wheat at US$6.39 per bushel in its latest weekly report, lending backbone to the uptick.
What matters today. The divergence where wheat rose while soybean and corn tracker funds fell shows a market disentangling South American row-crop abundance from tighter milling-wheat sentiment.
01 The session in one read
Grains moved in two directions on Thursday. The soy and corn proxies edged down while wheat pushed higher, producing a session shaped more by individual crop fundamentals than by a single macro force.
The soybean-tracking fund SOYB settled at US$25.18, a dip of 0.12%. The corn tracker CORN fell a sharper 0.39% to US$17.76. The wheat fund WEAT rose 0.49% to US$24.62, the only one of the three to post a gain.
Thursday’s trade carried a distinct crop-specific logic. Soybeans and corn, the two pillars of the Brazil-Argentina export machine, eased as the market digested improving harvest prospects across the Southern Hemisphere. Wheat, by contrast, advanced on the back of firm U.S. cash markets, where September hard red winter wheat was quoted at US$6.39 per bushel. The split suggests that grain buyers are comfortable with near-term feed and oilseed availability but less sanguine about milling-quality wheat. The variable to watch is whether China returns as a large-scale soybean buyer before the U.S. harvest swells inventories.
02 The board
Reading the proxy board tells a granular story. The SOYB fund’s decline to US$25.18 reflects a soft oilseed tone, consistent with a U.S. soybean market trading in the neighbourhood of US$11.6 per bushel.
CORN’s fall to US$17.76 underlines the weight of a well-supplied global corn balance sheet, anchored by the December 2026 corn contract near 441.50 US cents per bushel according to a recent Bloomberg screen. WEAT alone showed muscle, with its US$24.62 close finding support from U.S. wheat values that saw September soft red winter wheat at US$6.00 per bushel and hard red winter at US$6.39 per bushel in the most recent U.S. Wheat Associates report.
| Asset | Level | Change |
|---|---|---|
| Soybeans (SOYB) | US$25.18 | -0.12% |
| Corn (CORN) | US$17.76 | -0.39% |
| Wheat (WEAT) | US$24.62 | +0.49% |
Source: RT close, 2026-07-30. Where a commodity has no spot feed, an exchange-traded tracker or leading producer is shown as a labelled proxy.
Live Market IntelligenceThe live market board
Rio Times · Live Market Intelligence
Latin America — Cross-Market Board
| Instrument | Last | Change | YoY | Prev. | High | Low | Volume |
|---|---|---|---|---|---|---|---|
| IBOV | 186,299.96 | -0.16% | +21.85% | 186,595.60 | 168,310 | 167,142 | — |
| IPSA | 11,426.61 | +0.61% | — | 11,357.82 | 11,210 | 10,984 | 1,513,213,483 |
| IPC MEX | 63,536.96 | +0.25% | +12.17% | 63,375.93 | 66,121 | 65,405 | 108,886,187 |
| MERVAL | 2,990,605 | -0.28% | +30.51% | 3,022,485 | 3,042,365 | 2,991,150 | — |
| COLCAP | 2,570.03 | +0.17% | — | 9.04 | 9.05 | 9.02 | 4,133 |
| BVL PERÚ | 59,529.36 | +0.20% | — | — | — | — | — |
| USD/BRL | 5.16 | +0.01% | -5.13% | 5.16 | 5.18 | 5.14 | — |
| EUR/BRL | 5.95 | +1.01% | -5.83% | 5.89 | 5.98 | 5.94 | — |
| USD/MXN | 17.06 | -0.24% | -8.58% | 17.10 | 17.08 | 17.01 | — |
| USD/CLP | 913.98 | +0.04% | -5.67% | 913.65 | 915.11 | 906.68 | — |
| USD/COP | 3,140 | +0.03% | -22.04% | 3,139 | 3,141 | 3,105 | — |
| USD/PEN | 3.36 | -0.66% | -4.82% | 3.38 | 3.38 | 3.35 | — |
| USD/ARS | 1,493 | +0.10% | +12.96% | 1,491 | 1,494 | 1,480 | — |
| USD/UYU | 40.27 | +1.24% | +1.80% | 39.77 | 40.27 | 40.23 | — |
| USD/PYG | 5,939 | +1.68% | -19.54% | 5,841 | 5,939 | 5,925 | — |
| USD/BOB | 11.64 | -0.76% | +72.04% | 11.73 | 11.72 | 11.64 | — |
| USD/DOP | 58.34 | +1.25% | -3.44% | 57.62 | 58.34 | 58.04 | — |
| USD/CRC | 445.92 | +0.89% | -9.71% | 441.97 | 448.50 | 445.92 | — |
03 What moved it
For soybeans, the dominant driver remains the two-step of U.S. weather and Chinese demand. A recent trading-economics note pointed to Midwest conditions and firmed-up expectations of Chinese buying as the forces behind a US$11.6-per-bushel conversation, and Thursday’s SOYB slip suggests the demand side of that equation has yet to deliver.
Corn succumbed to the gravitational pull of Brazilian and Argentine supply. With Brazil’s safrinha crop moving through its final stages and Argentina’s fields recovering from last year’s drought, the CORN fund felt the pressure of ample exportable surpluses even without a fresh cargo statistic to prove it.
Wheat’s move up was a different creature. U.S. cash markets provided the anchor, with hard red winter wheat quoted at a premium to soft red winter wheat, suggesting that high-protein milling wheat is tightening even as feed grains remain heavy.
04 The Latin American read
Brazil and Argentina are the world’s export engine for soybeans and corn, and Thursday’s moves indirectly reflect that reality. Whenever the CORN fund falls in a quiet session, the market is implicitly betting that Brazilian trucks and Argentine grain elevators will keep global stocks replenished.
The currency link is the silent partner in every trade. The Brazilian real’s level against the dollar determines whether a farmer in Mato Grosso sees a profitable price for a bag of soybeans or holds back supply. Though Thursday offered no confirmed real fixing, the direction of the SOYB fund suggests a market alert to any shift that might trigger a wave of farmer selling.
05 The names to watch
The exchange-traded proxies themselves are the direct names for an international investor: the SOYB fund for soybeans, the CORN fund for corn, and the WEAT fund for wheat. Their daily closes at US$25.18, US$17.76, and US$24.62 provide a liquid, dollar-denominated window into the grain complex.
Behind those funds sit the powerhouse commodity merchants and processors. Archer-Daniels-Midland, Bunge, and Cargill move physical soybeans from Santos to Shanghai, and their trading books are deeply sensitive to whether the U.S. soybean price holds near US$11.6 per bushel while May 2026 global soybean values, as tracked by the IMF via FRED, ran around 439 and change.
06 The outlook
The market heads into August with a clear set of question marks. For soybeans, the SOYB fund’s stability below US$25.20 makes a China purchase announcement the most powerful upside catalyst available. For corn, the CORN fund at US$17.76 will struggle to rally while Brazil’s safrinha keeps arriving at port, unless U.S. ethanol margins or feed demand surprise to the upside. Wheat, trading through the WEAT fund at US$24.62, looks to hold its gain if hard red winter wheat premiums maintain their firm tone into the September contract expiry.
07 What to watch
- China purchase announcements: A single flash sale of U.S. or Brazilian soybeans to China would lift the SOYB fund sharply from its US$25.18 perch.
- Brazilian real vs dollar: A real weakening past a threshold that triggers farmer selling would pressure CORN and SOYB by unlocking more supply.
- U.S. Midwest weather August 1-10: Extended hot-and-dry maps during soybean pod-setting would reverse the SOYB fund’s soft tone.
- Hard red winter wheat premium: If the HRW premium above US$6.39 per bushel persists, WEAT could extend its lone rally.
Frequently Asked Questions
Why did the SOYB fund fall on Thursday?
The SOYB fund slipped 0.12% to US$25.18 as U.S. soybean prices near US$11.6 per bushel faced headwinds from waiting-for-China sentiment and advancing South American supply.
Why did corn drop while wheat rose?
Corn’s 0.39% decline to US$17.76 reflects Brazil’s big safrinha harvest, while wheat’s 0.49% gain to US$24.62 drew on firm U.S. cash markets where hard red winter wheat fetched US$6.39 per bushel.
How does Latin America influence these prices?
Brazil and Argentina are the world’s main soybean and corn exporters; the flow of their harvests into global channels sets the physical backdrop that the SOYB and CORN funds price.
What is the currency link for grain prices?
The Brazilian real-dollar exchange rate determines a farmer’s local-currency return and can either encourage or freeze selling, directly affecting the volume hitting export markets.
This article was produced by The Rio Times’ automated newsroom system. How we use AI · Report an error
LatAm Markets: Live Signals → — real-time movers, turnover leaders and FX across Latin America.
Read More from The Rio Times